
Advertisement
Advertisement
Stocks’ Subtle Clue for USDX and Gold/Silver Investors
Published: May 21, 2025, 17:00 GMT+00:00
Almost there. At least that’s what it seems like based on today’s charts.

There is some action in all of them, but the two ones provide key information: the S&P 500 Index futures chart and the chart featuring the USD Index.
The stock market chart is important as it seems that it’s the one keeping other markets afloat. This includes gold price, silver price, and mining stock prices – and this is why keeping an eye for stocks is important, even if you don’t aim to directly trade them or invest in them.
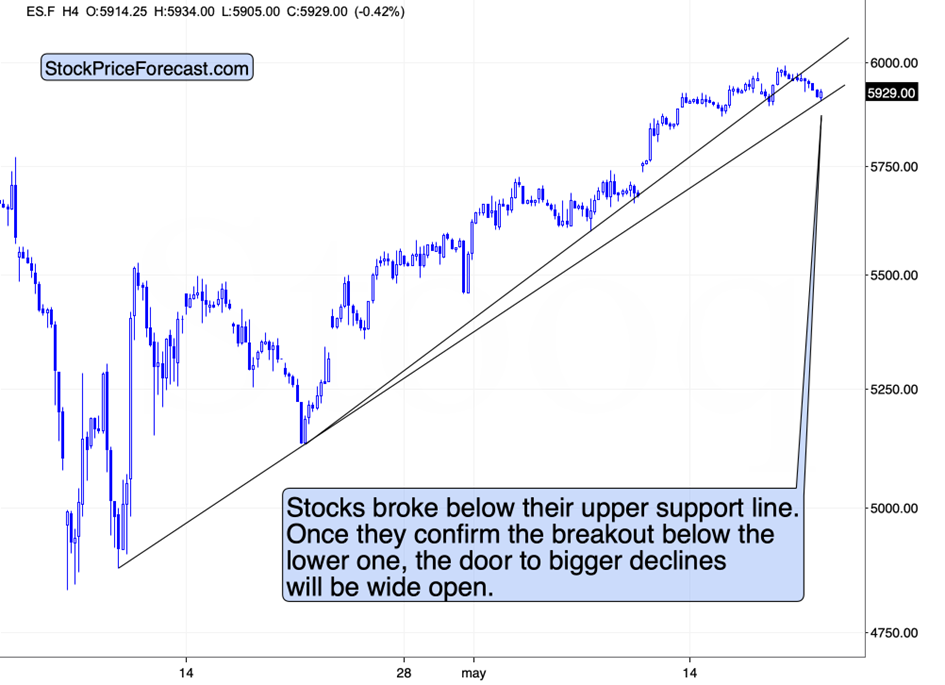
The thing is that for the first time this month, we saw a decisive short-term breakdown below the higher of the rising support lines as well as the move to the lower of the lines.
Is This the Start of the Downtrend?
The first breakdown could be a subtle clue that the trend has shifted right after the S&P 500 failed to move above the 6,000 mark.
Quoting my yesterday’s analysis:
Stocks are not doing much today – they are finally declining, but will they manage to close the day lower? Did the 6,000 level finally trigger a reversal?
That remains to be seen. In my view, it’s quite obvious that the next big move lower in stocks is going to be to the downside, and it’s based not just on the technical grounds, but also based on the damage done to world trade by tariffs – despite the recent truce (it’s far from being a deal) between U.S. and China, the tariffs are still higher than they were before April, and this is likely to continue to impact the markets.
Stocks previously made several attempts to move and hold above the 6,000 level, and each attempt failed. It could indeed be the case that this time stocks won’t manage to even get above this level before turning south.
On a side note, Paul Rejczak just took profits from his JPM long trade – 6.5% in about two weeks (here’s a link to the analysis where he opened the trade, if you’re interested – he even correctly predicted that it would last 1-2 weeks). He also has a protective stop-loss in his long position in stocks (getting his subscribers out with a profit if it gets hit).
So far, he’s been correct on this rally, but it seems to me that a turnaround is really close, especially given the big likelihood for the USD Index to soar.
Given today’s initial breakdown and the move to the more important support line (which could be broken any hour now), it seems that the rally might have just ended.
A rally in the USD Index could add to the bearish case, and as I’ve been emphasizing in my previous analyses, the medium-term outlook for it, is very bullish here.
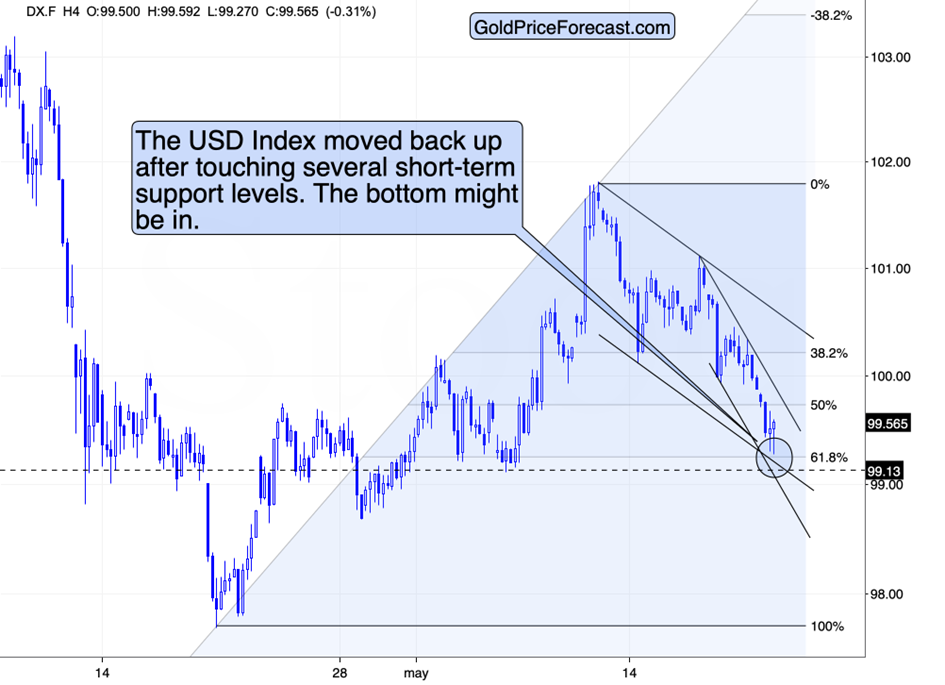
On a short-term basis, we see another re-test of the 100 level. This time, the USDX moved close to its May lows, the lower borders of the declining short-term trend channels, and the 61.8% Fibonacci retracement level.
It’s not visible on the above chart, but the major support level that was also reached today was the 2023 low.
Naturally, this support held and the USDX is now moving back up.
Let’s keep in mind that the USD Index’s outlook is primarily determined by the long-term charts that I’ve been covering recently – what we see above is just a short-term indication that the big move higher might have started here. Now, long-term charts are much more important than the short-term ones, so even if the USDX didn’t bottom here, it’s still likely to bottom soon and rally in the following weeks and months.
And the implications of those moves higher are very bearish for commodities and precious metals. The same goes for mining stocks, only to a bigger extent, if stocks decline (which is likely to happen).
Copper at a Turning Point
Speaking of commodities, copper appears to be ripe for a big move in any direction.
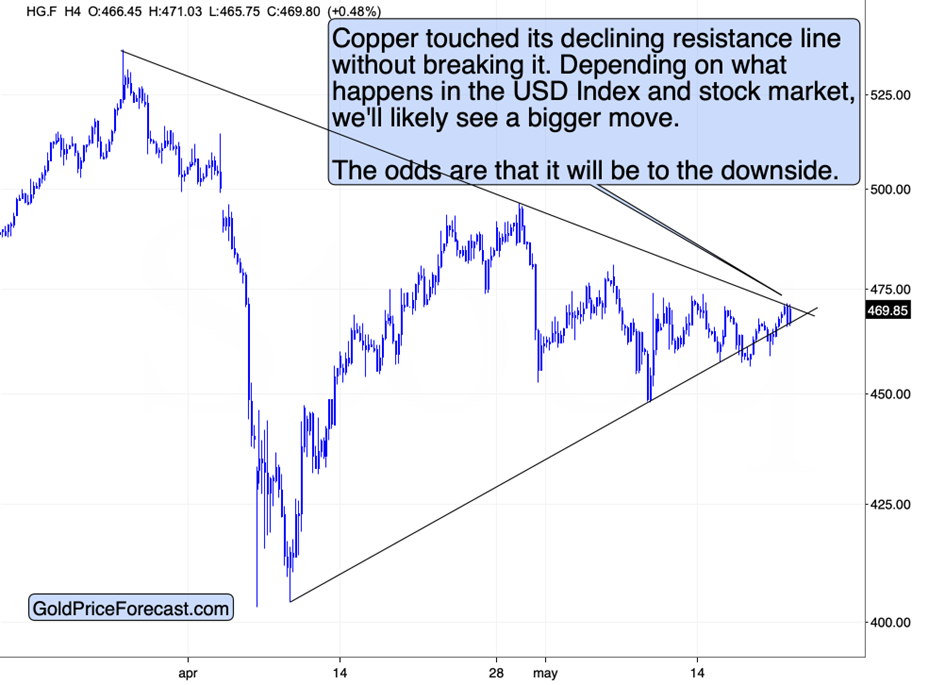
I’m writing about a big move in any direction, because of the declining volatility – that’s how markets often prepare for a sharp move up or down. It’s the calm before the storm kind of situation.
The tension is rising as the price is trading between its rising and declining resistance and support lines. It will have to break in one way or another and then confirm this move.
If the USDX just formed its bottom, copper likely formed its top. This means that we could see copper’s breakdown below the declining resistance line any hour now. More importantly, this time, the breakdown could be confirmed.
There is another possibility for this week, as the triangle-vertex-based reversal for copper is due tomorrow. This means that – given copper’s very bearish picture for the medium term – we could see a fake move higher today and early tomorrow, which would then be reversed, and the big decline would start then.
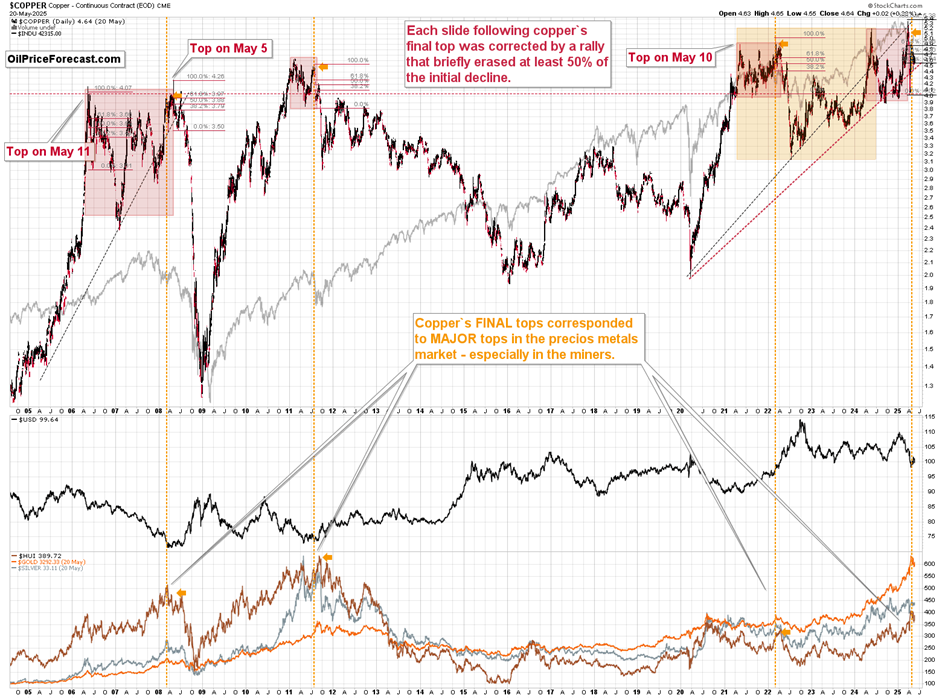
Let’s keep in mind that copper is after an invalidation of the move to new highs, and it has a very strong seasonal pattern pointing to lower prices in the following weeks / months.
Taking it all together points to a major rally in the USD along with a decline in stocks and commodities, which is likely to trigger declines also in the precious metals sector.
Also, I’m not sure if you saw the notification on Golden Meadow® or if you read it in my previous free analyses, but on Thursday (2PM EST), we’re hosting a webinar with Keith Weiner, CEO of Monetary Metals. Keith also serves as President of the Gold Standard Institute USA and holds a PhD from the New Austrian School of Economics.
I’ve spoken with Keith and he’s a kind and extremely knowledgeable person when it comes to all-things-gold. During the webinar, he’ll cover his outlook for gold, and he’ll answer questions that the viewers might have (ever wondered what would a seasoned Austrian economist with many years of experience in gold investing say about something? It’s your chance to ask.) What might be most interesting is that he’ll explain how 100 oz of gold can become 121 oz in five years.
I’m sure that you’ll enjoy being there. Reserve your seat today.
Thank you.
Przemyslaw K. Radomski, CFA
Founder, Editor-in-chief
About the Author
Przemysław Radomskicontributor
Being passionately curious about the market’s behavior, PR uses his statistical and financial background to question the common views and profit on the misconceptions.


Advertisement