
Advertisement
Advertisement
NASDAQ Index, SP500, Dow Jones Forecasts – Rising Yields Challenge Key Technical Support Across Major Indexes
By:
Key Points:
- S&P 500 breaks below its 200-day moving average at 5,883.62, raising concerns about deeper market weakness ahead.
- Nasdaq 100 holds above both 50-day and 200-day MAs, but bearish reversal candle signals caution for tech bulls.
- Dow Jones closes under its 200-day MA at 43,065, while clinging to 50-day support at 41,211.4 amid bond-driven selling.

S&P 500 Closes Below 200-Day Moving Average as Treasury Yields Surge
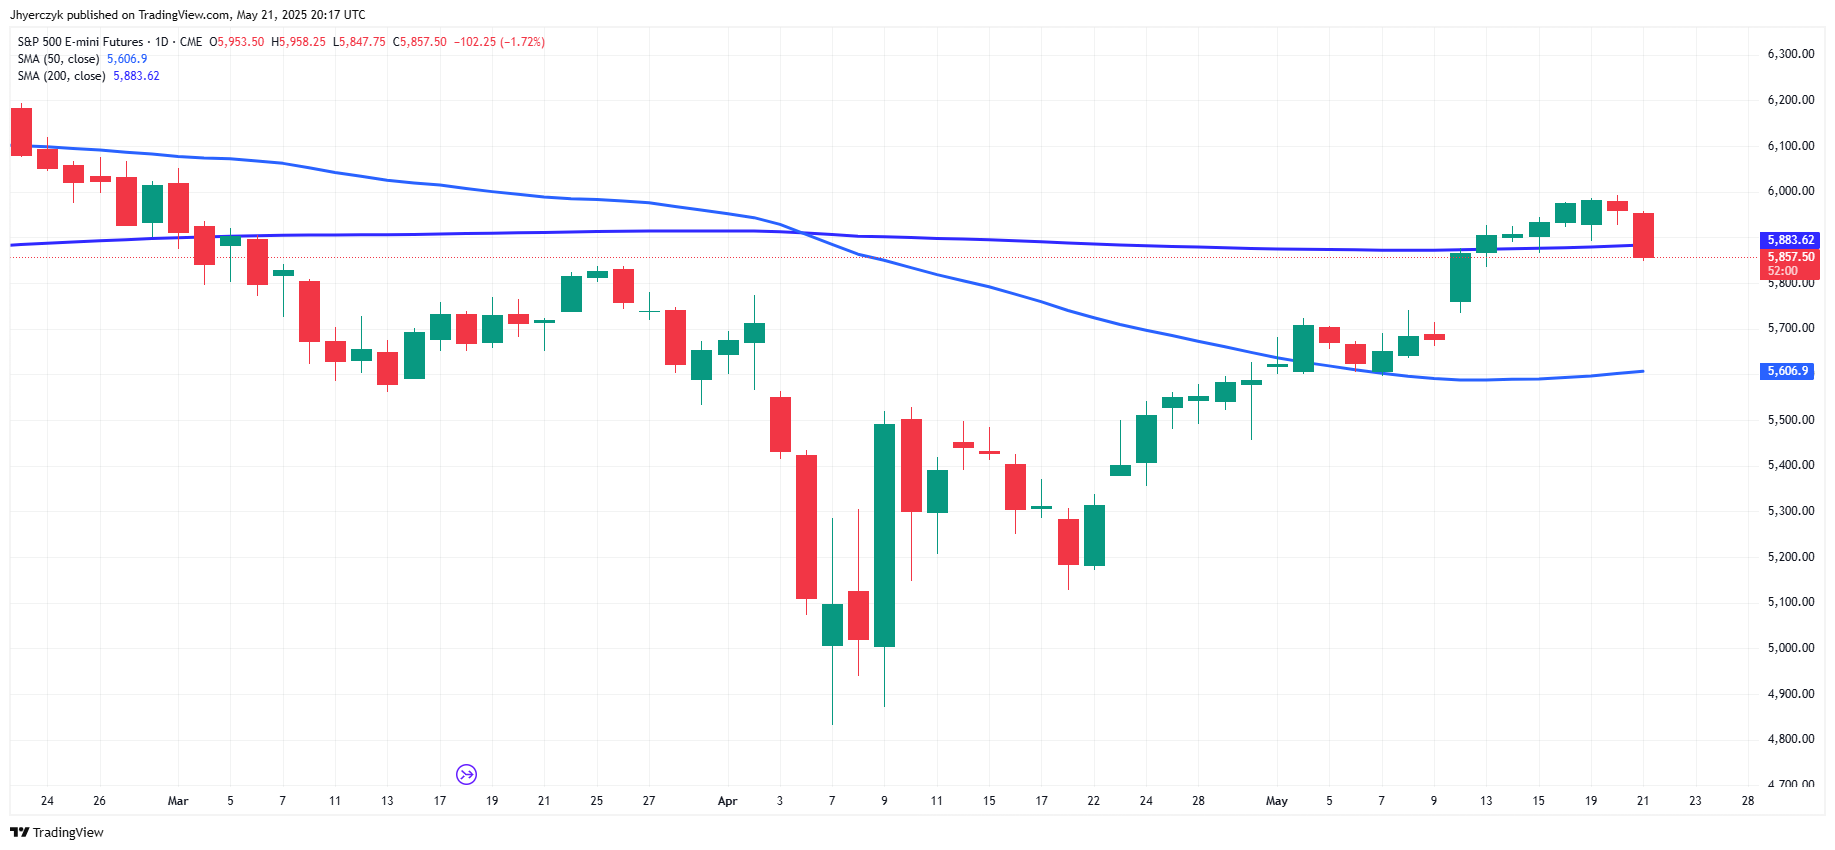
The S&P 500 dropped 1.61% to close at 5,844.61, settling below its 200-day moving average of 5,883.62 while remaining above the 50-day moving average of 5,606.90. The break below long-term support adds weight to concerns that rising borrowing costs could derail equity momentum.
What’s behind the move?
Yields soared following a weak 20-year Treasury auction and growing concerns about a deficit-expanding tax bill. The 30-year yield surged to 5.08%, the highest since October 2023. This pressured rate-sensitive sectors and triggered broad risk-off sentiment.
Stock-specific developments?
Fair Isaac plunged 15.7%, AES fell 9.9%, and Moderna declined 7.8%. Alphabet rose 2.8%, among a handful of gainers. Market breadth was overwhelmingly negative, with nearly 88% of NYSE volume tied to decliners.
What’s next?
Watch for a potential test of 5,800 as near-term support. If yields continue climbing, the S&P 500 could slip toward its 50-day moving average at 5,606.90. Friday’s PCE inflation data could significantly shape market direction.
Nasdaq 100 Remains Above Key Averages Despite Broad Tech Pressure
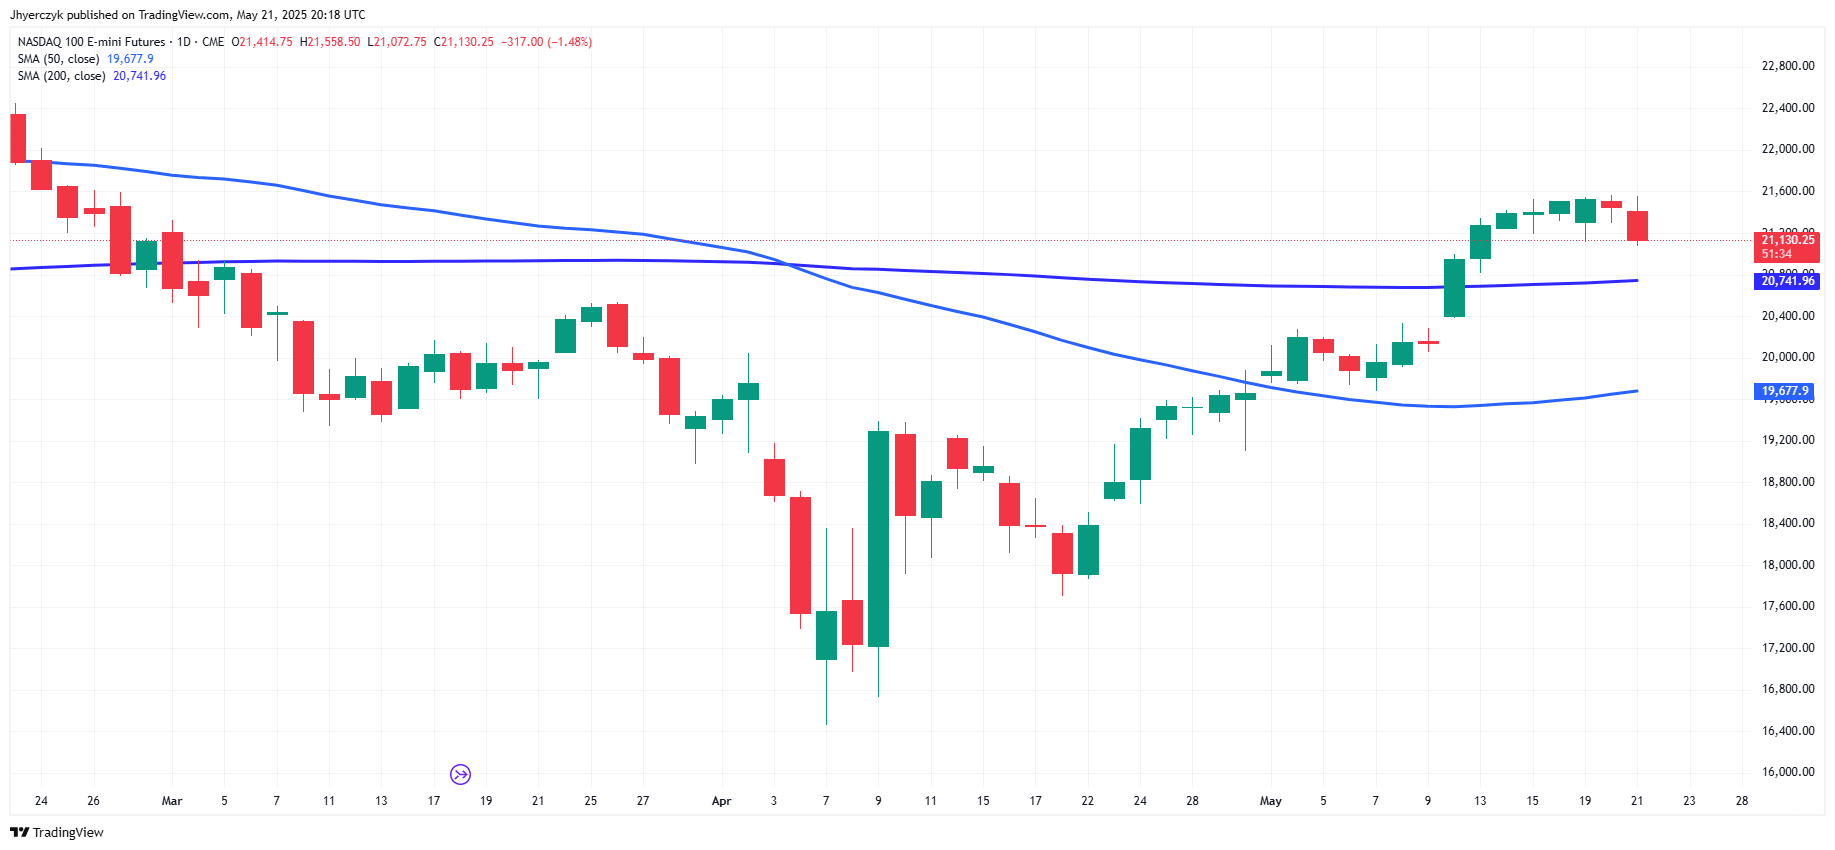
The Nasdaq 100 fell 1.48% to 21,130.25, but remains above both the 50-day moving average of 19,678.0 and the 200-day moving average of 20,741.99. Despite the pullback, the longer-term trend remains intact for now.
Where did the selling hit hardest?
Palo Alto Networks lost 6.8%, with Palantir, Shopify, and Airbnb each dropping close to 4%. Semiconductors also weakened. Alphabet bucked the trend, rising 2.8%, supported by continued optimism in AI.
What does the chart signal?
The index rejected resistance near 21,600 and printed a bearish engulfing candle. However, as long as it holds above 20,741.99, the uptrend remains valid. A break below the 50-day MA at 19,678.0 would be more concerning.
Key levels ahead?
A drop below 20,742 would suggest the rally is losing steam. Tech traders will be watching PCE inflation data and bond yields closely for clues on direction.
Dow Jones Slips Below 200-Day Moving Average but Holds 50-Day Support
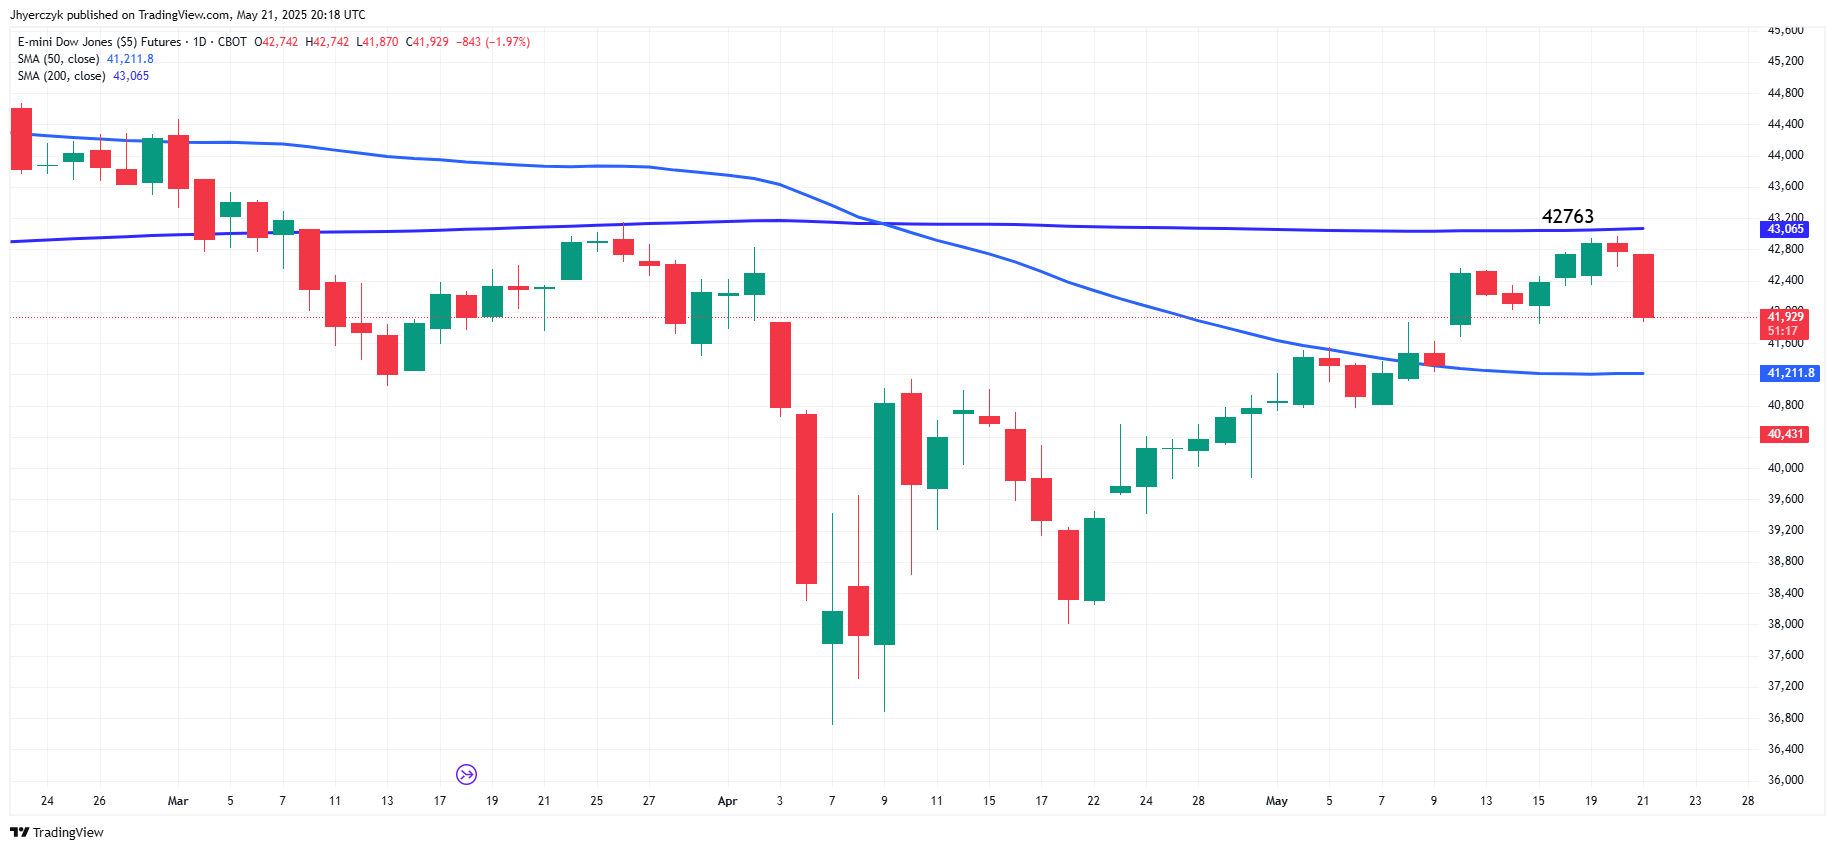
The Dow Jones Industrial Average fell 816.80 points (-1.91%) to 41,860.44, closing below the 200-day moving average of 43,065 but still above the 50-day moving average of 41,211.4. The breach of long-term resistance highlights mounting pressure on industrial and financial names.
What caused the drop?
Surging long-term yields rattled equity markets. UnitedHealth fell 5.8% following a downgrade, while Nike, American Express, and 3M each lost more than 3%. Defensive names like Walmart and Microsoft saw modest gains.
What does the setup look like?
The Dow is now caught between its 200-day resistance and 50-day support. A close below 41,211.4 would confirm a deeper breakdown, with next support near 40,400.
What’s on deck?
Focus turns to inflation data and additional Treasury auctions. If yields remain elevated, the Dow’s cyclical components may stay under pressure through month-end.
More Information in our Economic Calendar.
About the Author
James HyerczykProfits & Punchlines
Mr.Hyerczyk is a technical analyst, market researcher, educator and trader. Jim is an expert in the area of patterns, price and time analysis, Forex and stocks.


Advertisement