
Advertisement
Advertisement
Oil, Natural Gas, and US Dollar Analysis: Bearish Setup for Oil and Dollar Builds
By:
Key Points:
- WTI Crude Oil (CL) failed to break above the 50-day SMA and resumed its downward trend.
- Natural Gas (NG) found support at the 200-day SMA and resumed its upward trend.
- US Dollar Index (DXY) remains under bearish pressure and continues to trade lower.

Oil prices dropped on Wednesday following news of upcoming nuclear talks between the US and Iran. Oman’s foreign minister confirmed a fresh round of negotiations, which reduced geopolitical risk. Reports of a potential Israeli strike on Iranian nuclear facilities faded as diplomatic efforts gained traction.
WTI crude oil (CL) dropped to $61.26, while Brent crude oil (BCO) settled around $64.70. The market had briefly priced in supply risks from Iran due to tensions with Israel. However, expectations of renewed peace efforts outweighed fears of disruption.
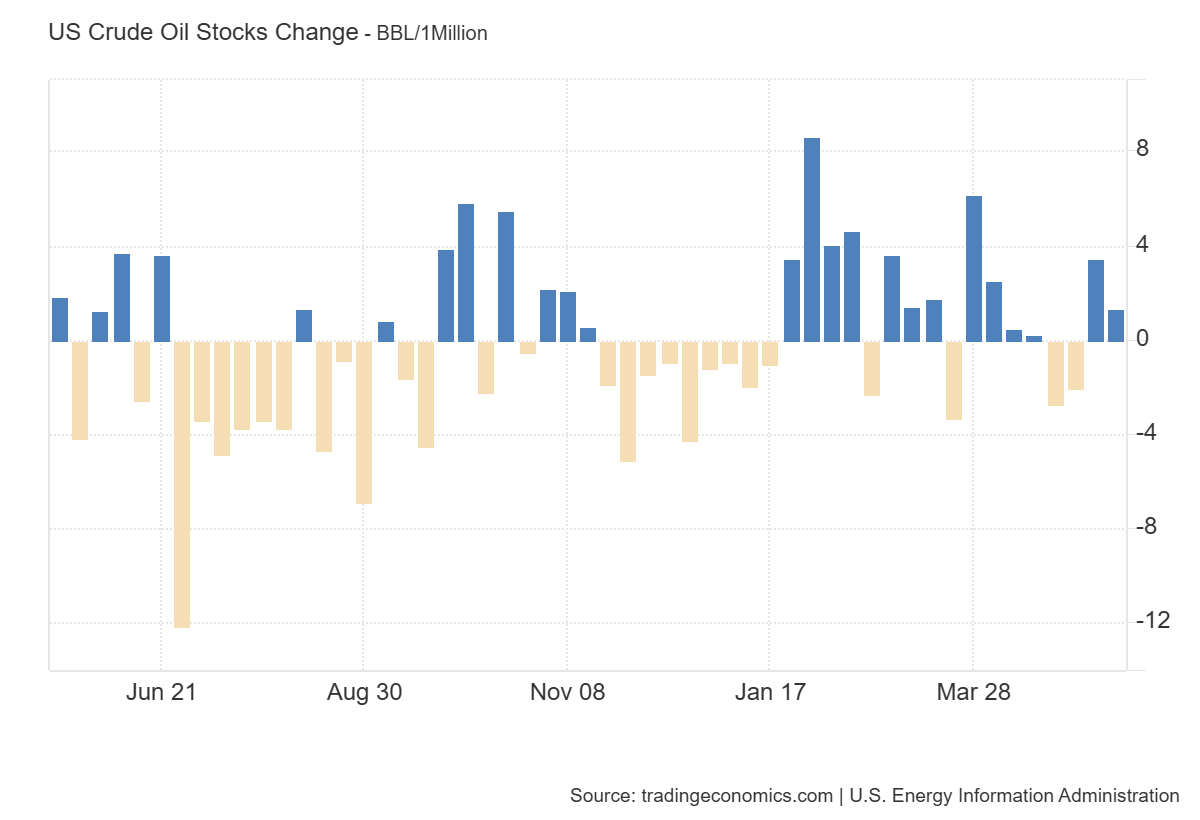
Moreover, bearish inventory data from the US added further pressure on oil prices. Crude stocks rose by 1.3 million barrels, gasoline by 800,000, and distillates by 600,000. These unexpected builds signaled weak demand and contributed to the downside momentum. Meanwhile, Kazakhstan’s 2% output increase in May defied OPEC+ targets, further reinforcing the bearish outlook.
WTI Crude Oil (CL) Technical Analysis
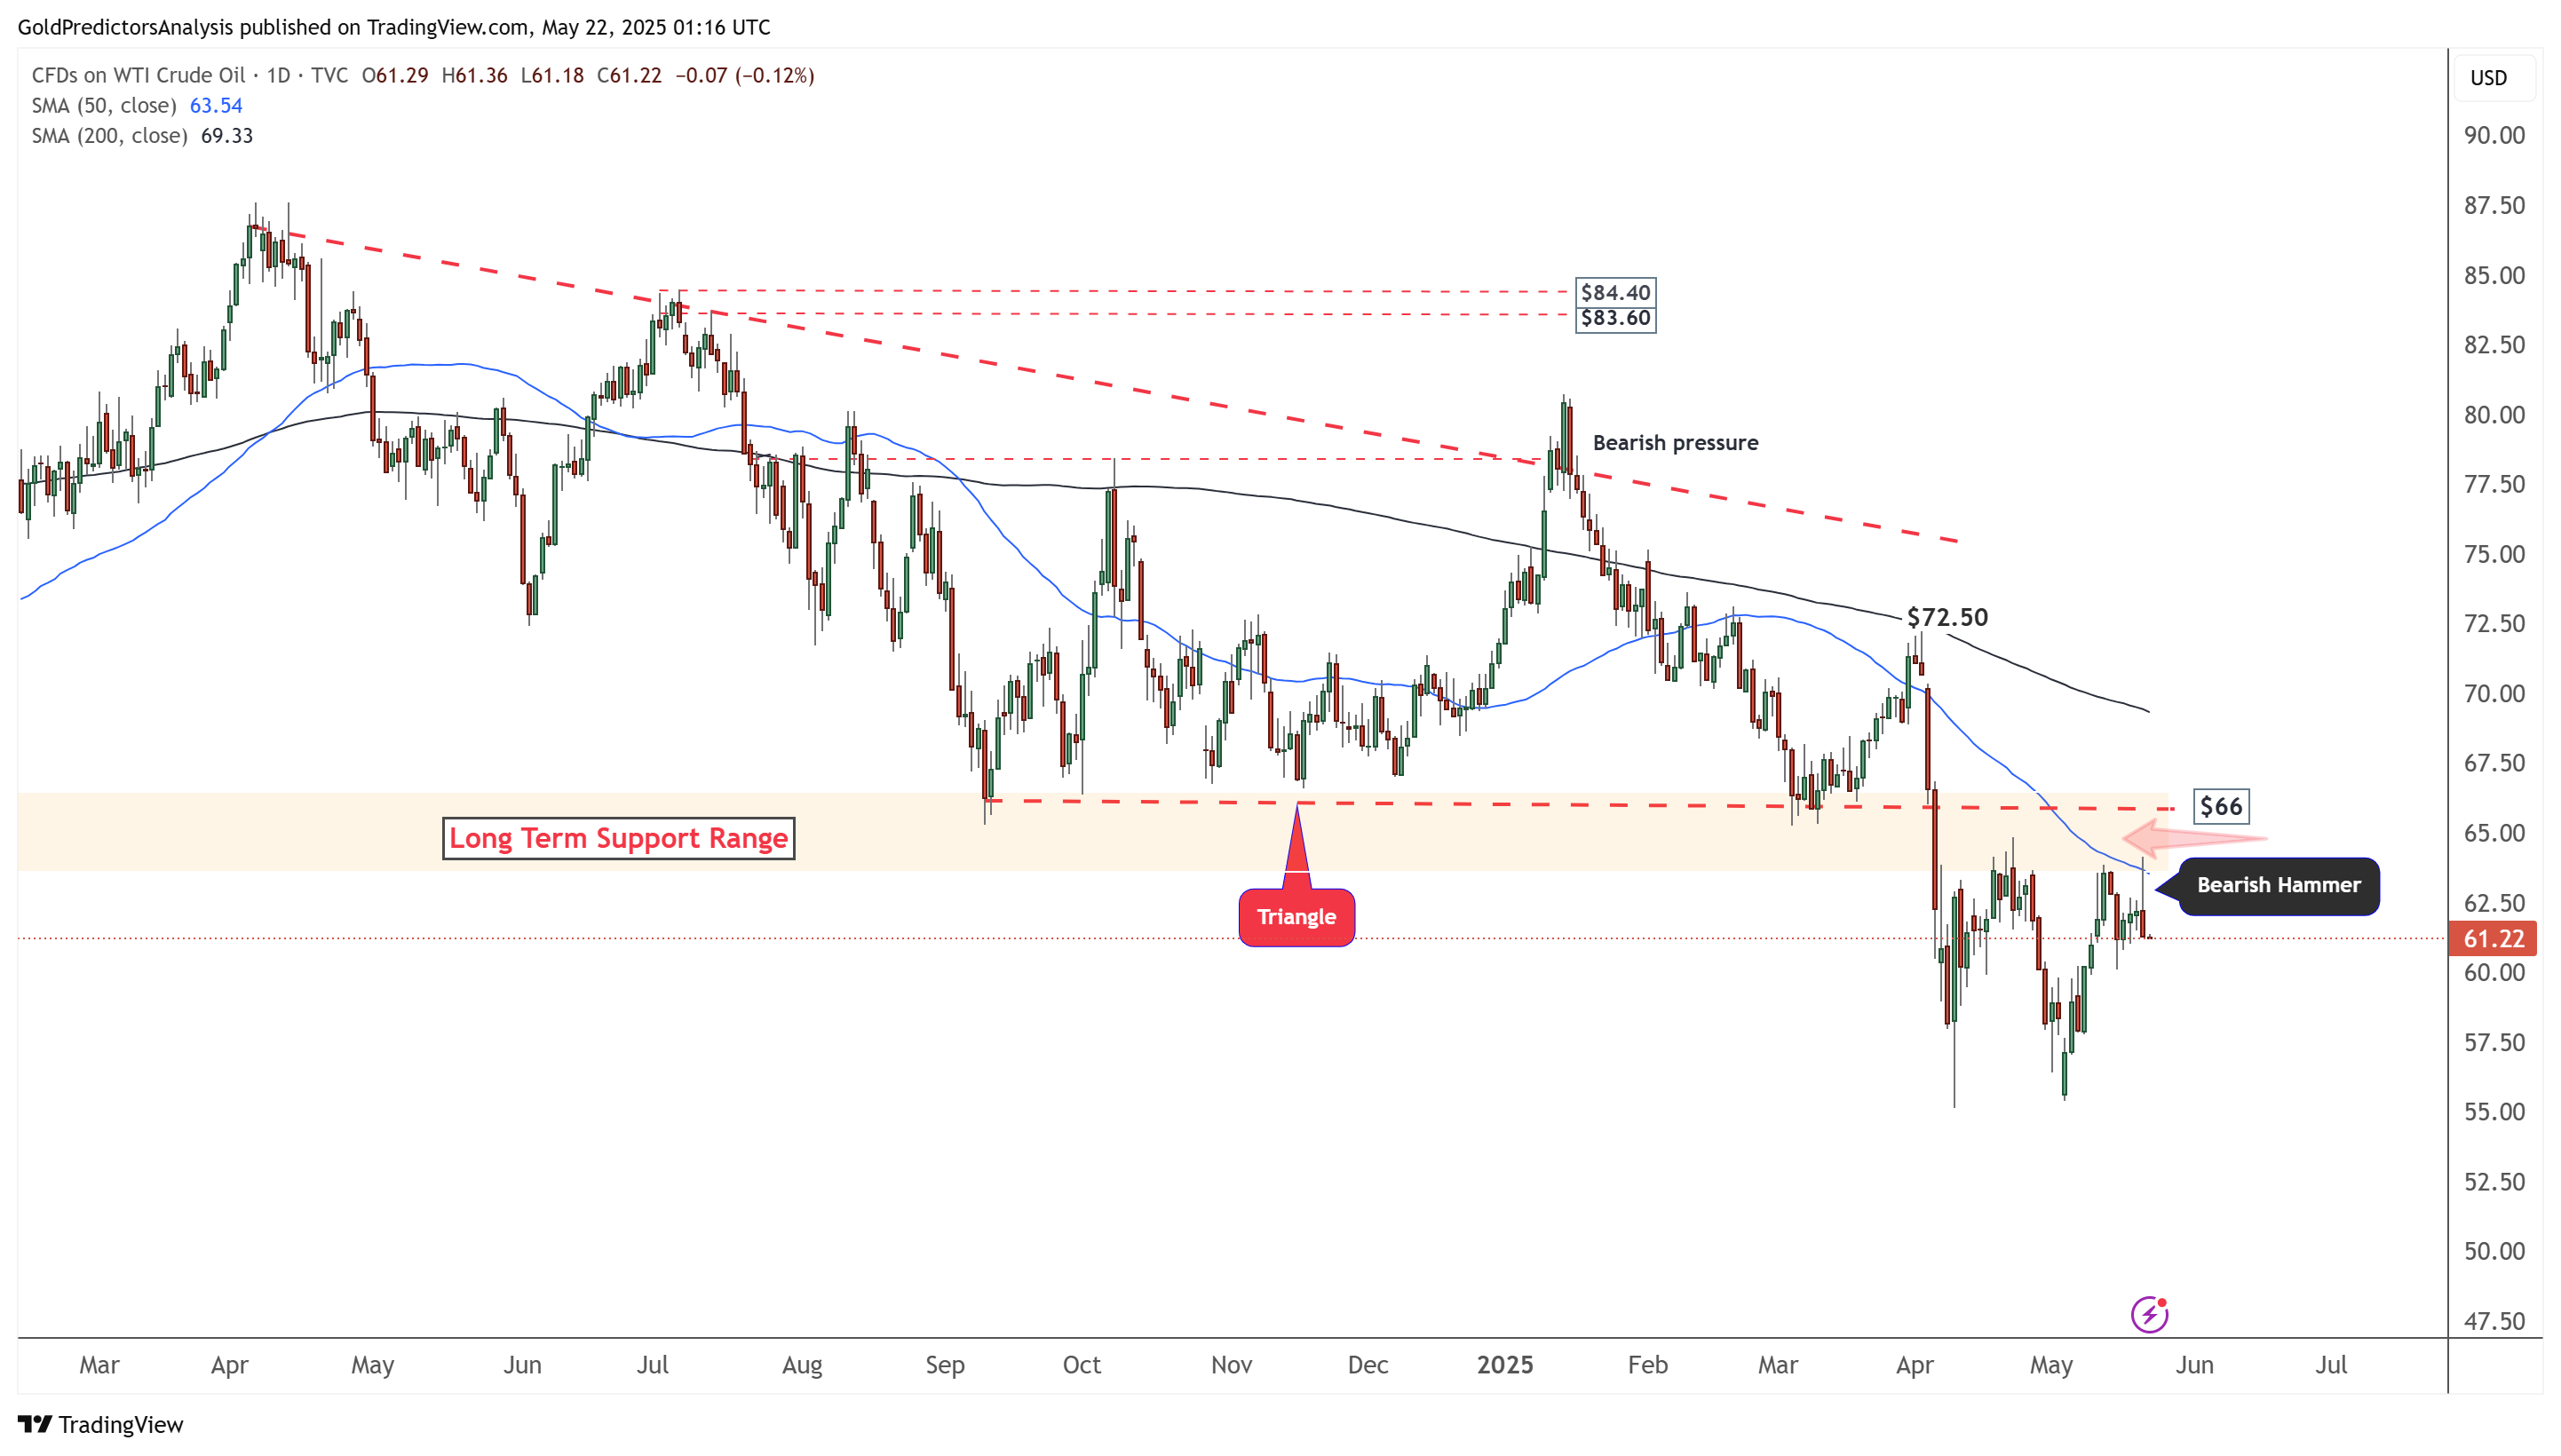
WTI Oil Daily Chart – Bearish Hammer
The daily chart for WTI crude oil shows that the price has reached the orange zone, representing a long-term support area broken in April. The price has formed a bearish hammer after testing this zone. This resistance is further reinforced by the 50-day SMA, making the orange zone a strong resistance level. The price remains below the 50-day and 200-day SMAs, indicating that the overall trend is still negative. A break below $60 would suggest further downside toward $55, confirming the continuation of the bearish trend.
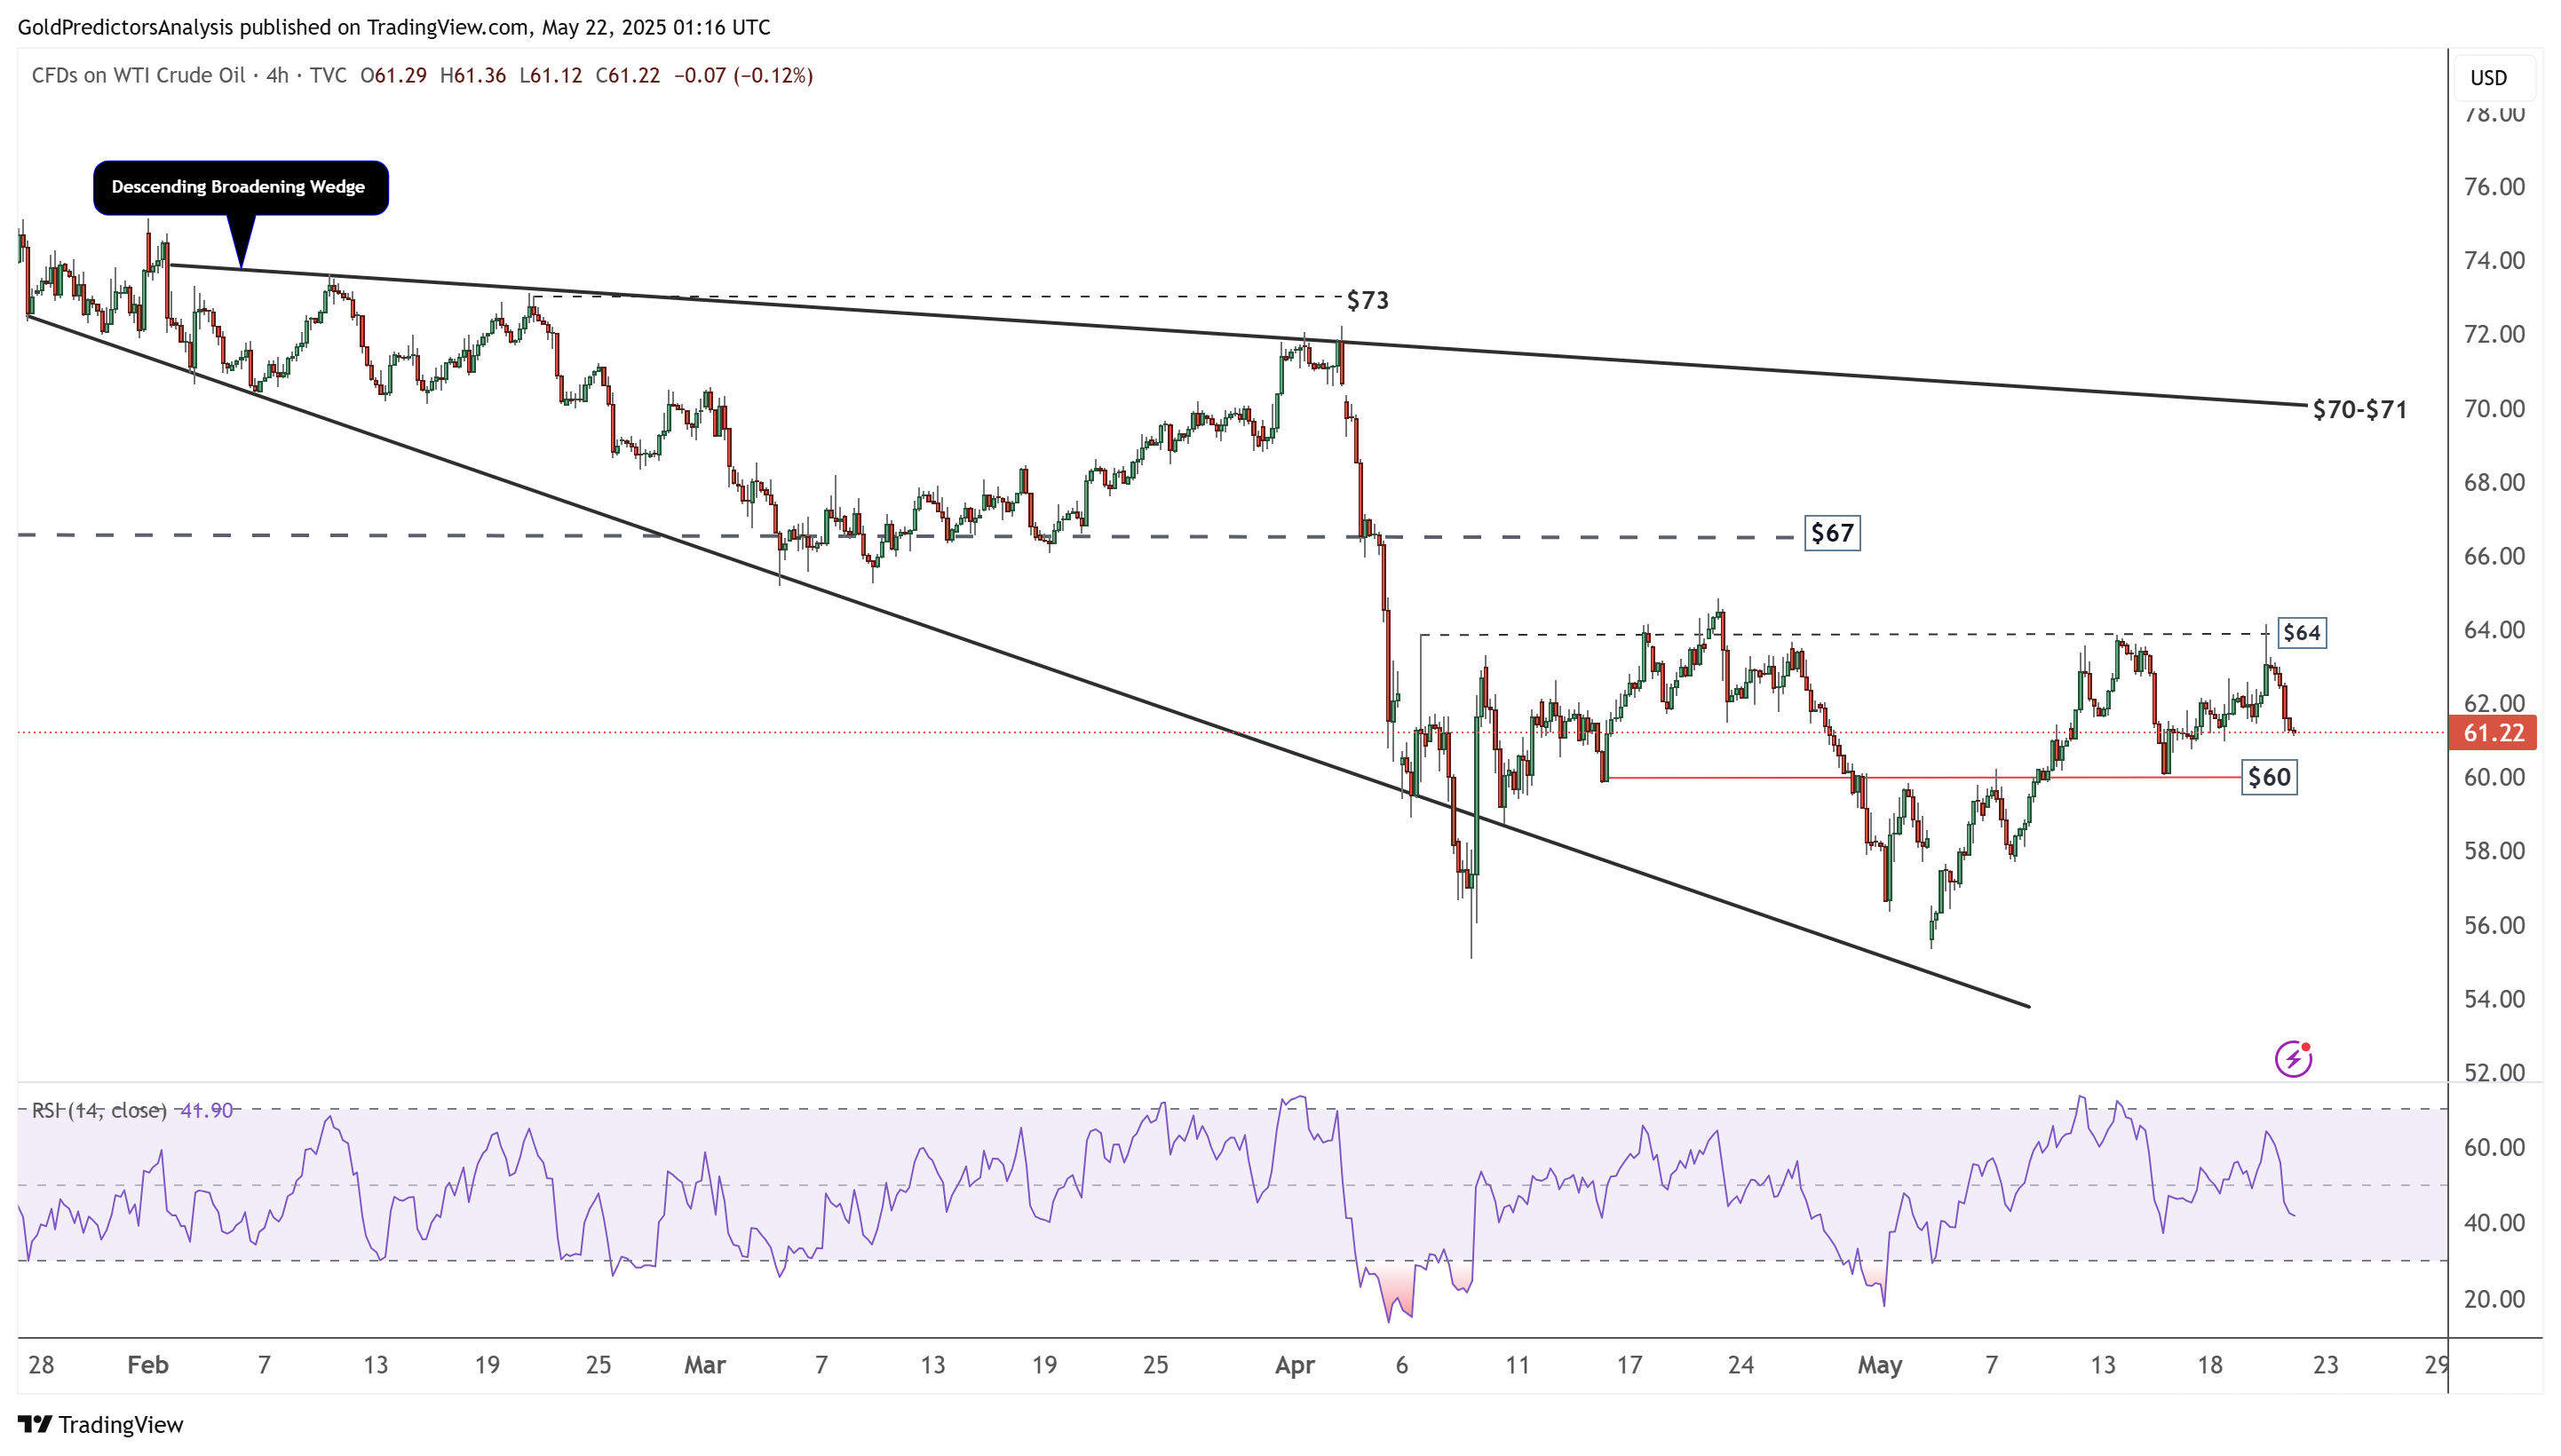
WTI Oil 4-Hour Chart – Descending Broadening Wedge
The 4-hour chart for WTI crude oil shows that the price is consolidating within a descending broadening wedge pattern. Short-term consolidation remains between $60 and $64; however, the overall price structure is still bearish. A break below $60 would signal further downside toward $55, while a break above $70 would invalidate the bearish trend and trigger an upward move.
Natural Gas (NG) Technical Analysis
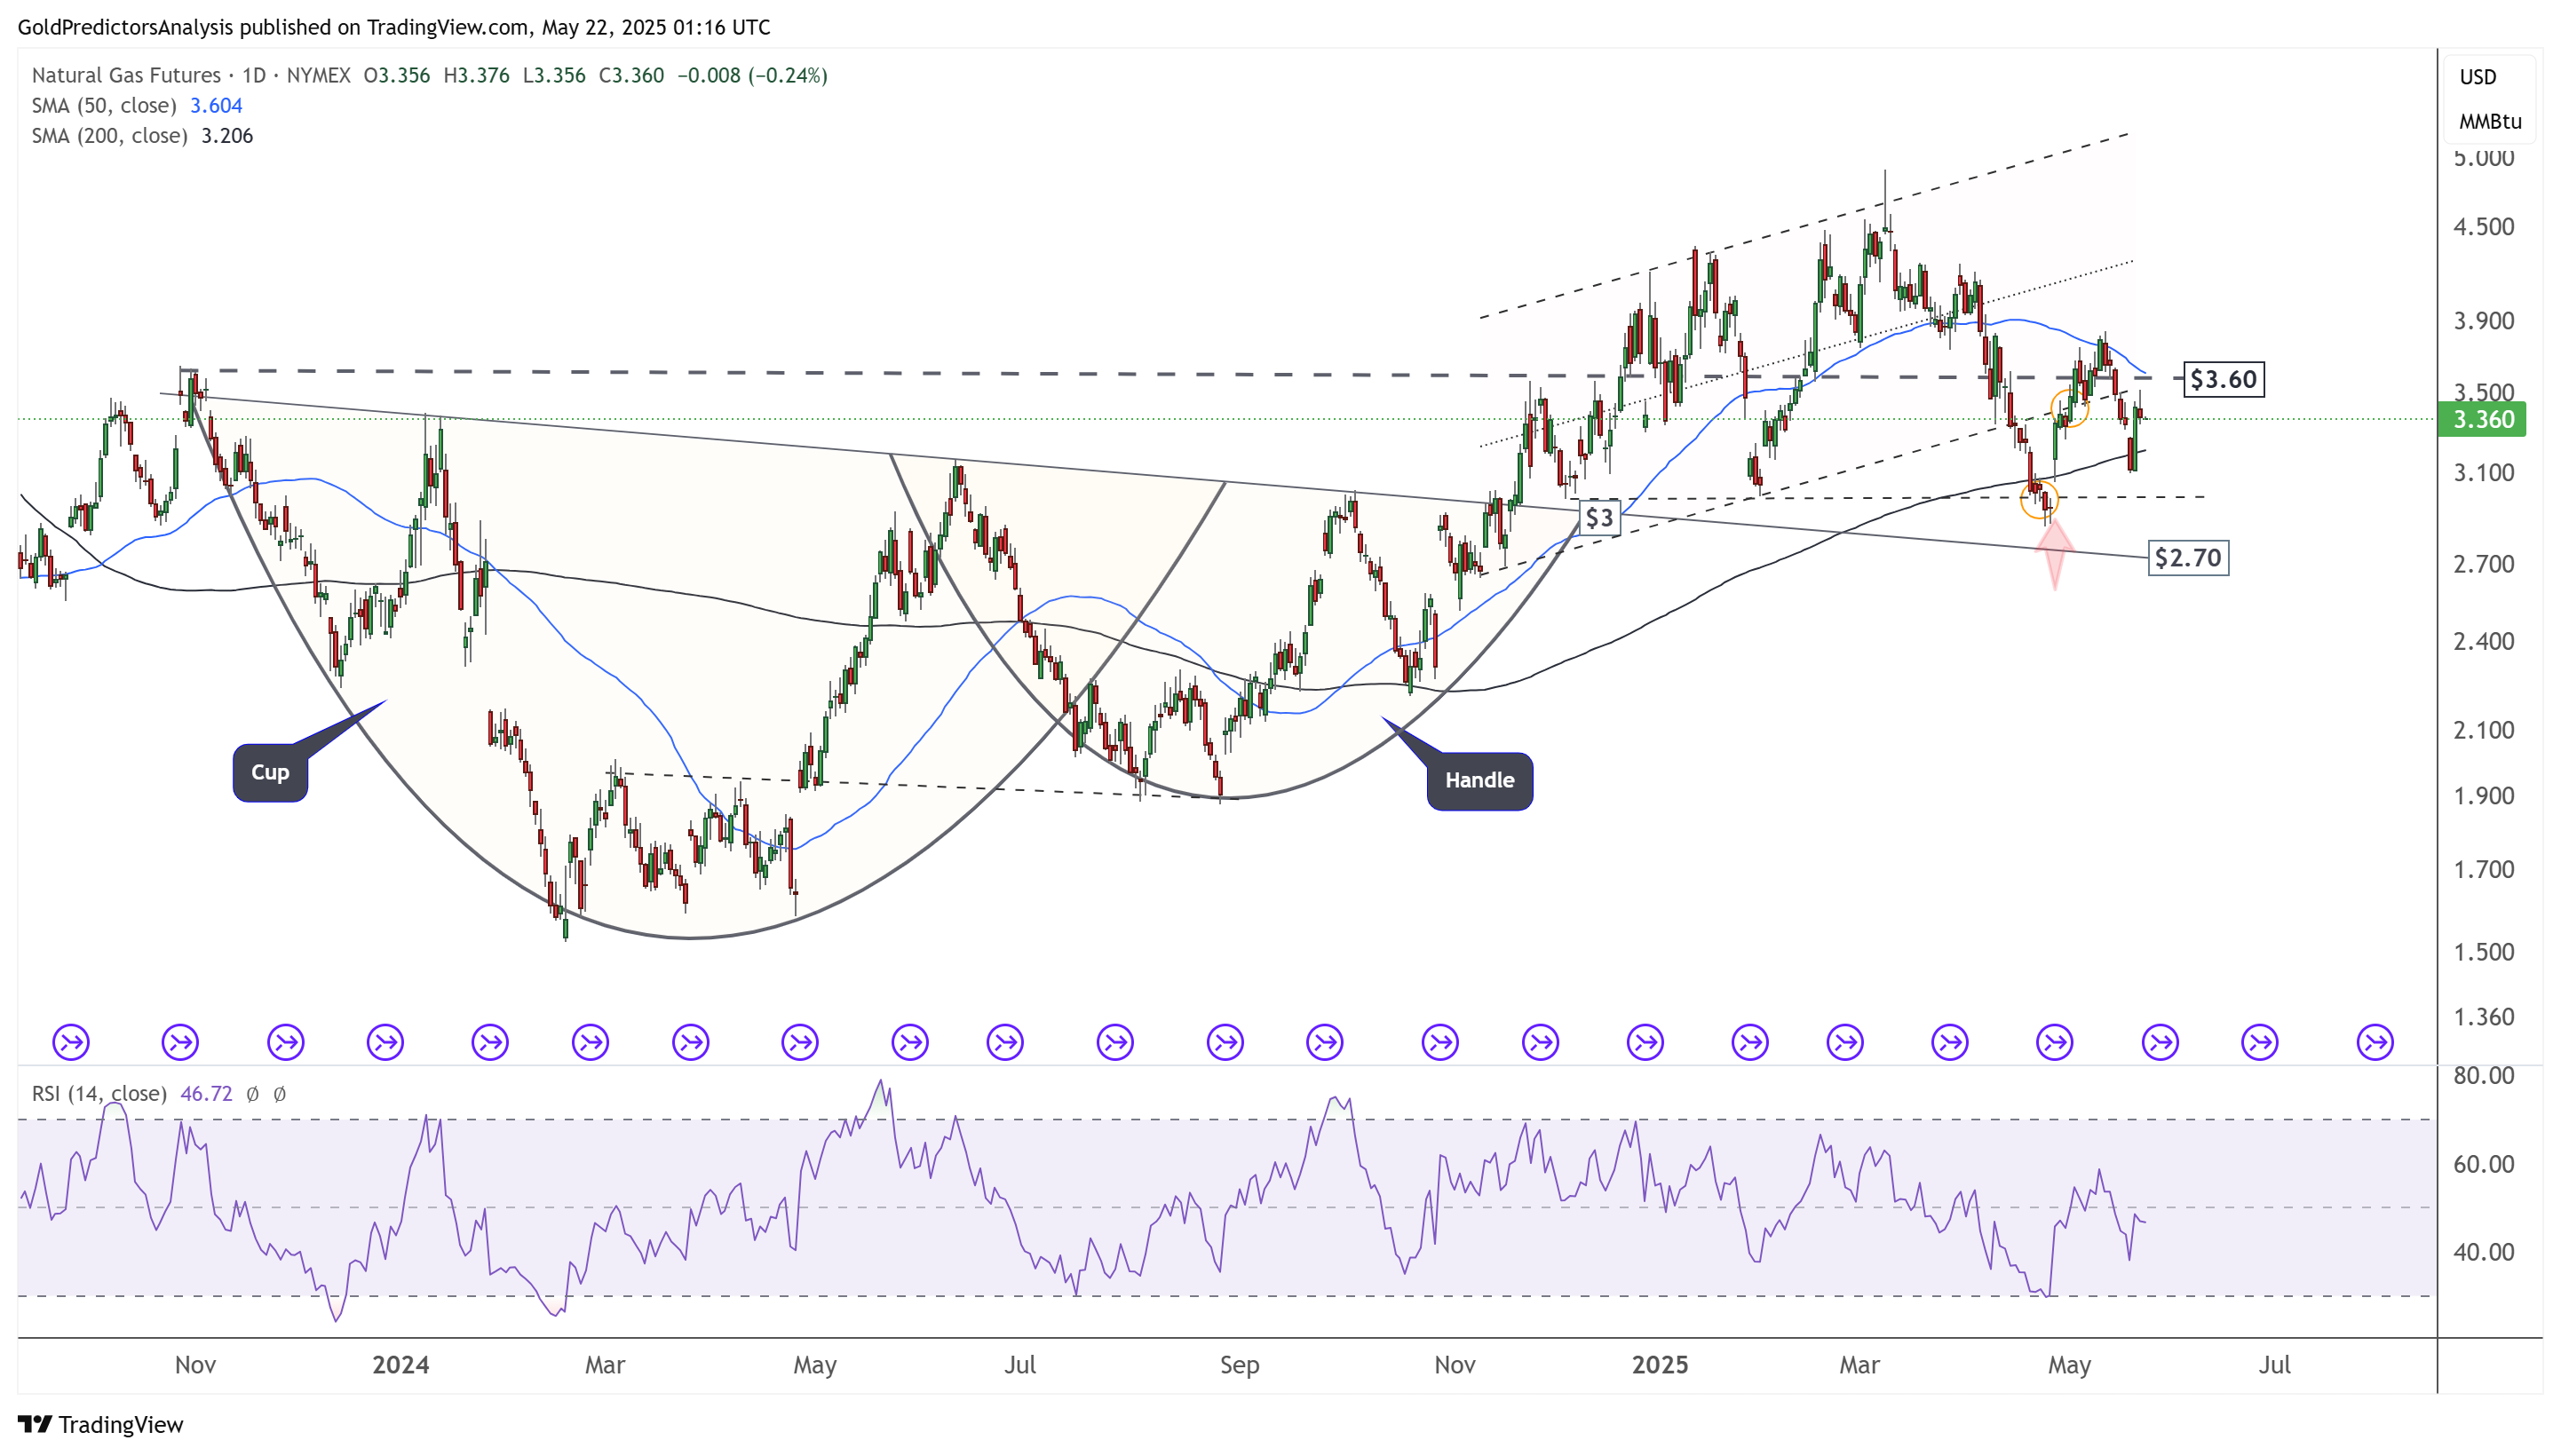
Natural Gas Daily Chart – Key Level of $3
The daily chart for natural gas shows that the price is consolidating around the 200-day SMA. The rebound from the $3.00 support level indicates an upward trend. A break above the 50-day SMA would signal further upside. However, the recent consolidation reflects market uncertainty. The price structure remains within the broader consolidation range between $3.00 and $5.00.
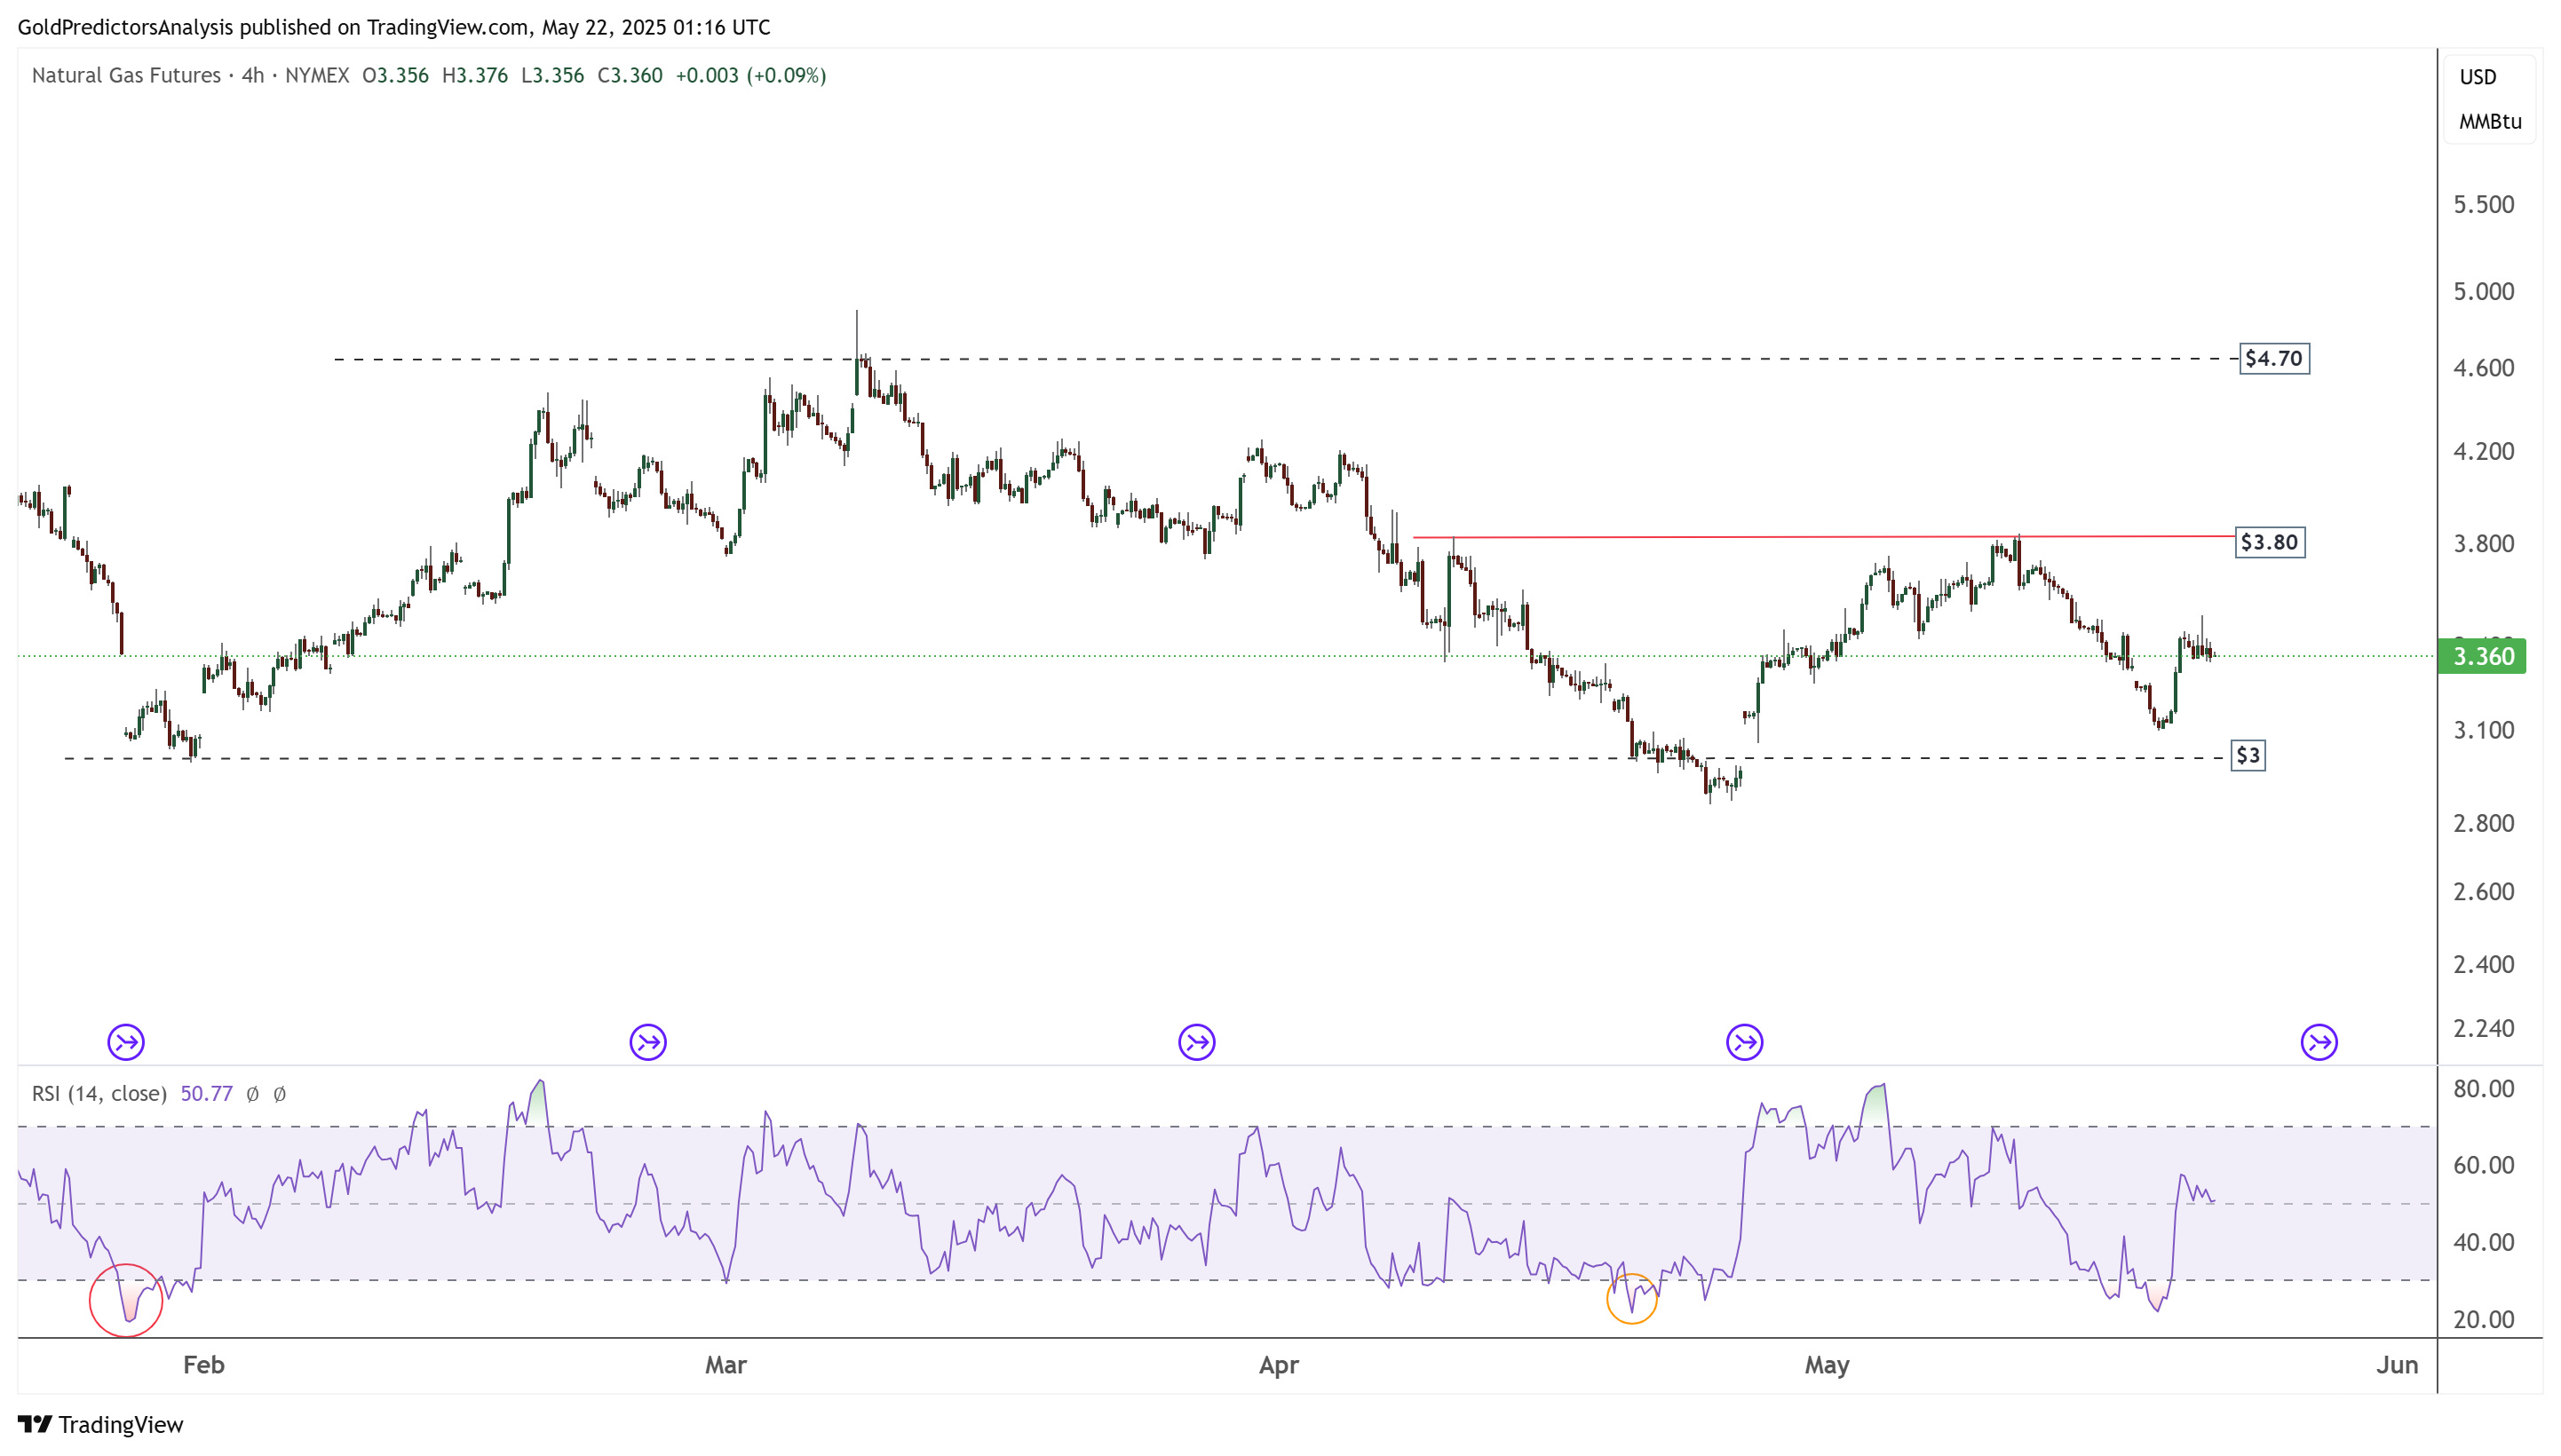
Natural Gas 4-Hour Chart – Rebound
The 4-hour chart for natural gas shows consolidation between the $3.00 and $3.80 levels. A break above $3.80 would signal further upside toward $4.70. Moreover, a breakout above $4.70 would confirm continued bullish momentum. The $3.00 region remains strong support; however, a break below $3.00 would indicate a downward trend toward $2.70.
US Dollar (DXY) Technical Analysis
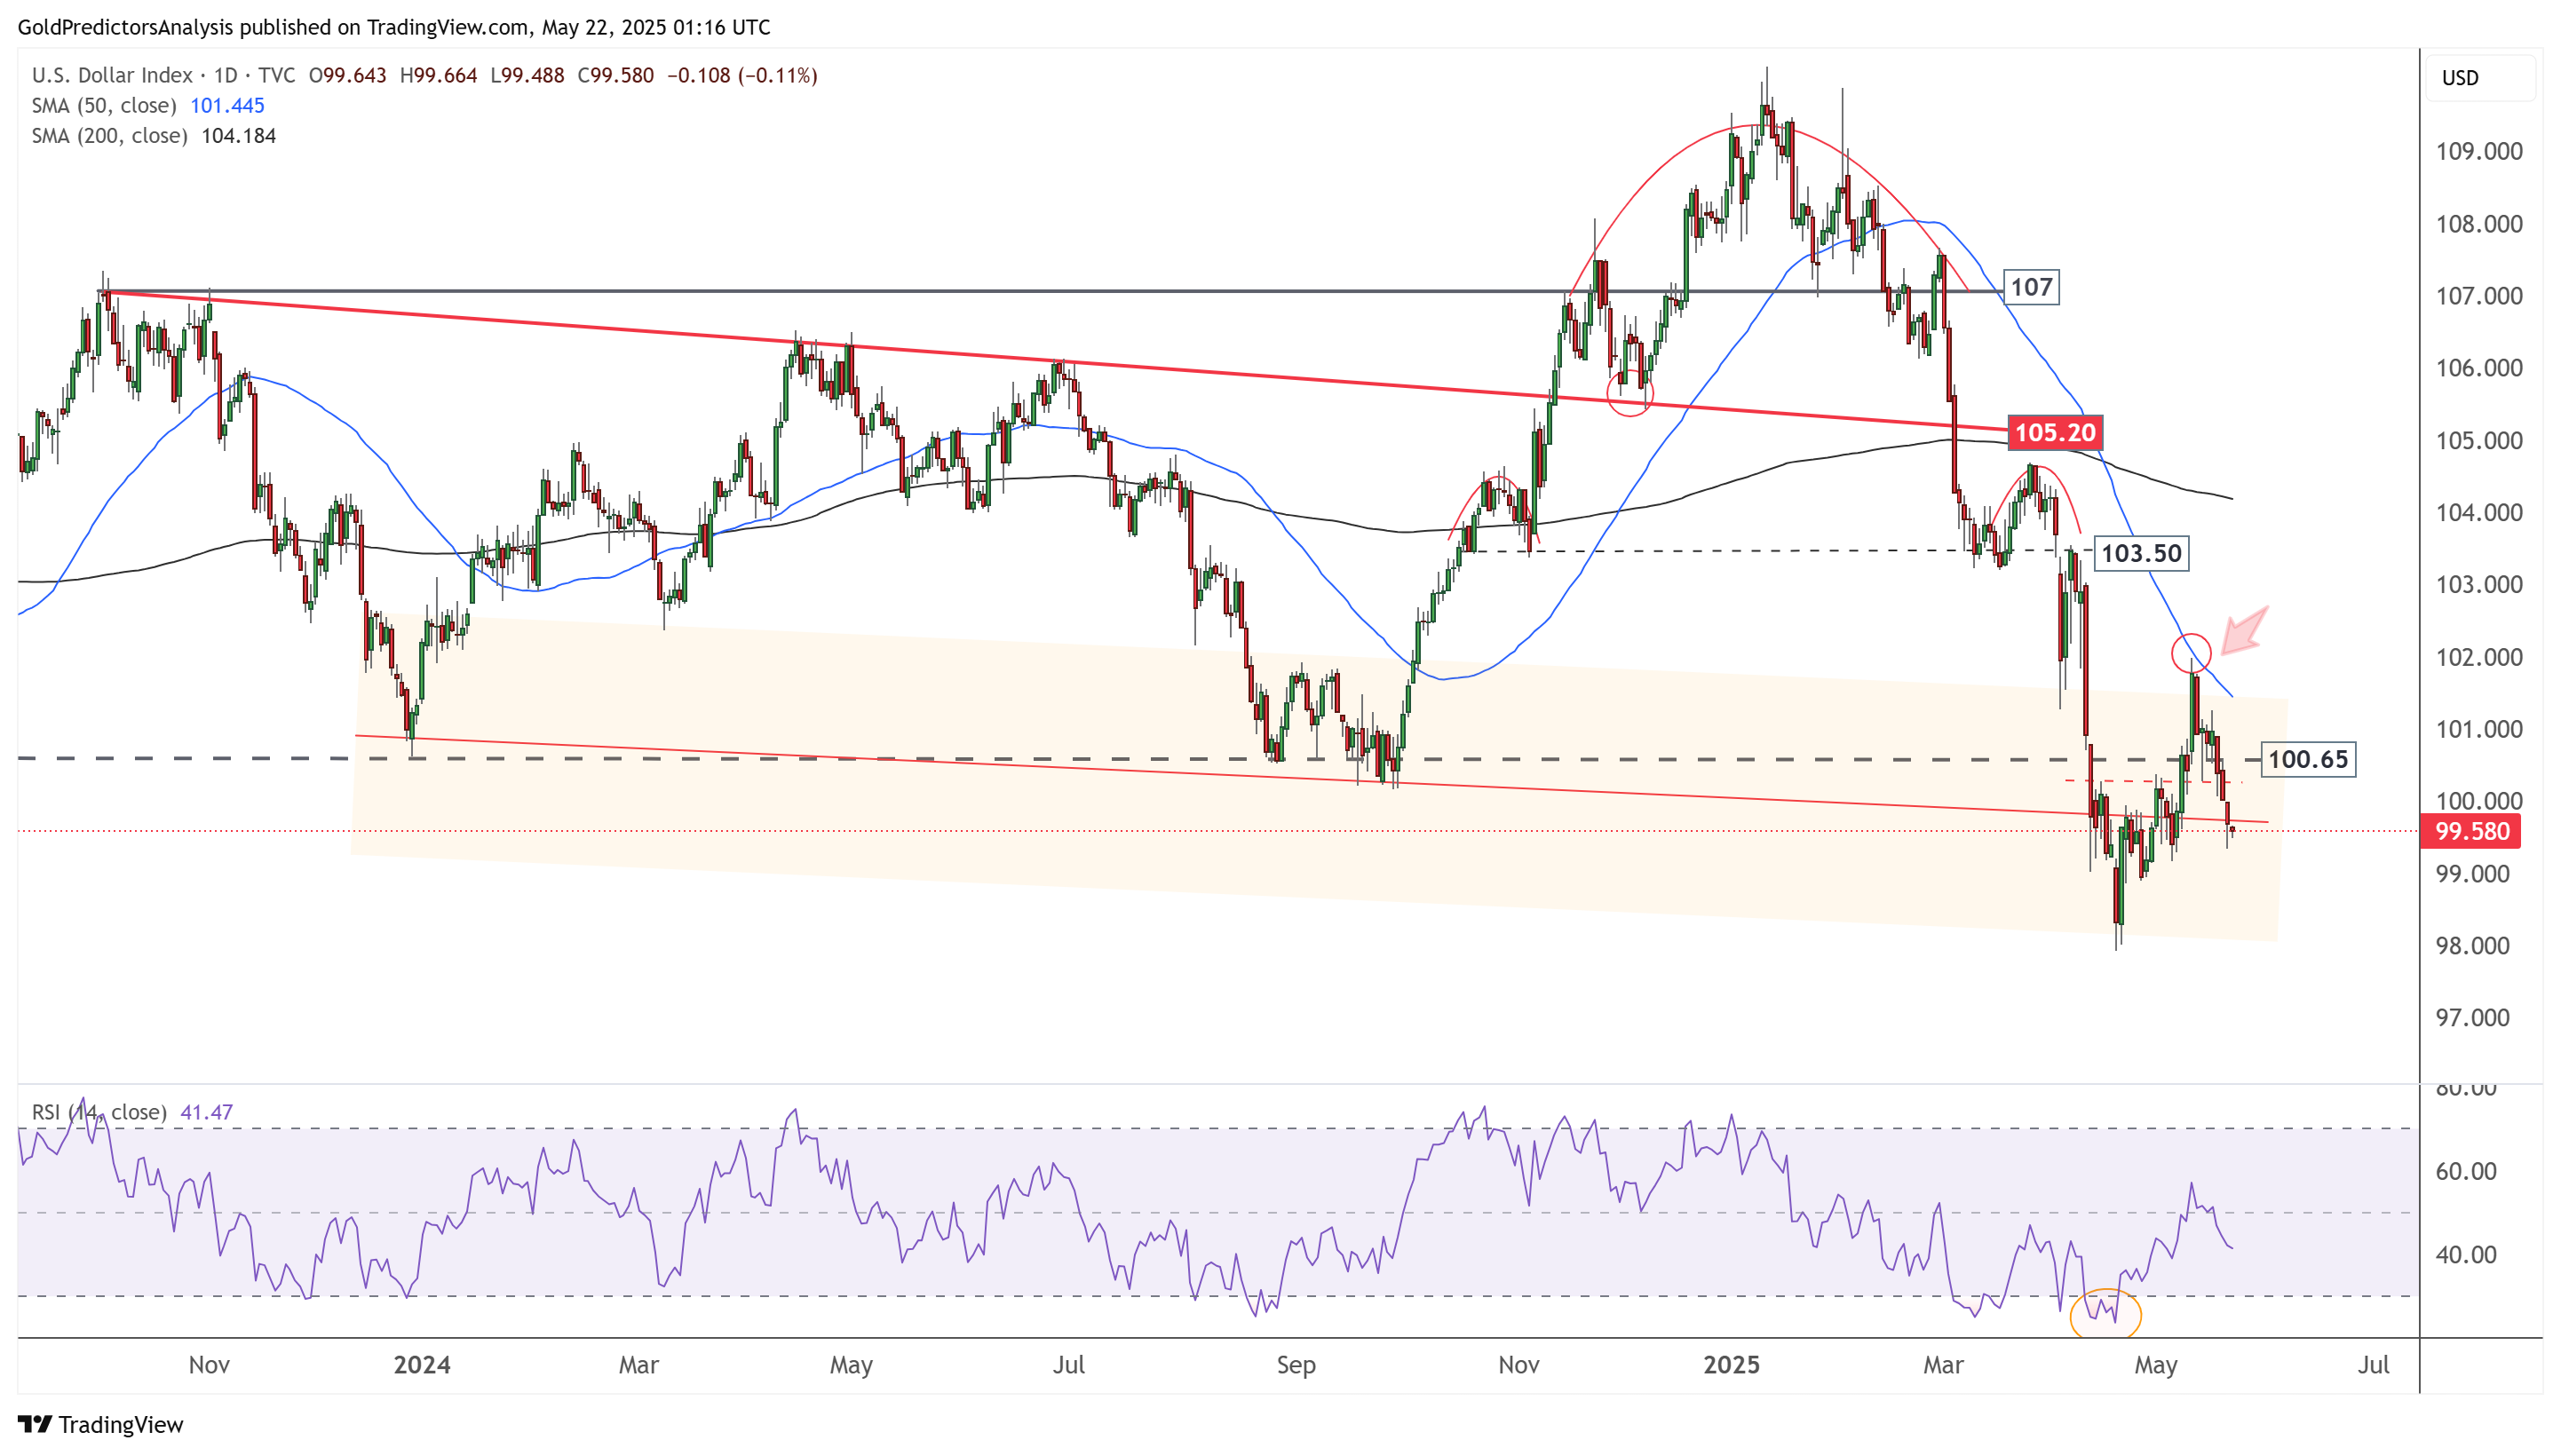
US Dollar Daily Chart – Bearish Pressure
The daily chart for the US Dollar Index shows an inverted head and shoulders pattern. The price is currently consolidating within the orange zone. The recent rebound from the 98 support level reached the 50-day SMA at 102 but failed to break above it. This rejection has triggered the next move to the downside. The index is likely to trend back toward the 98 region, and a break below this level would signal a continuation of the downward trend toward the 90 region.
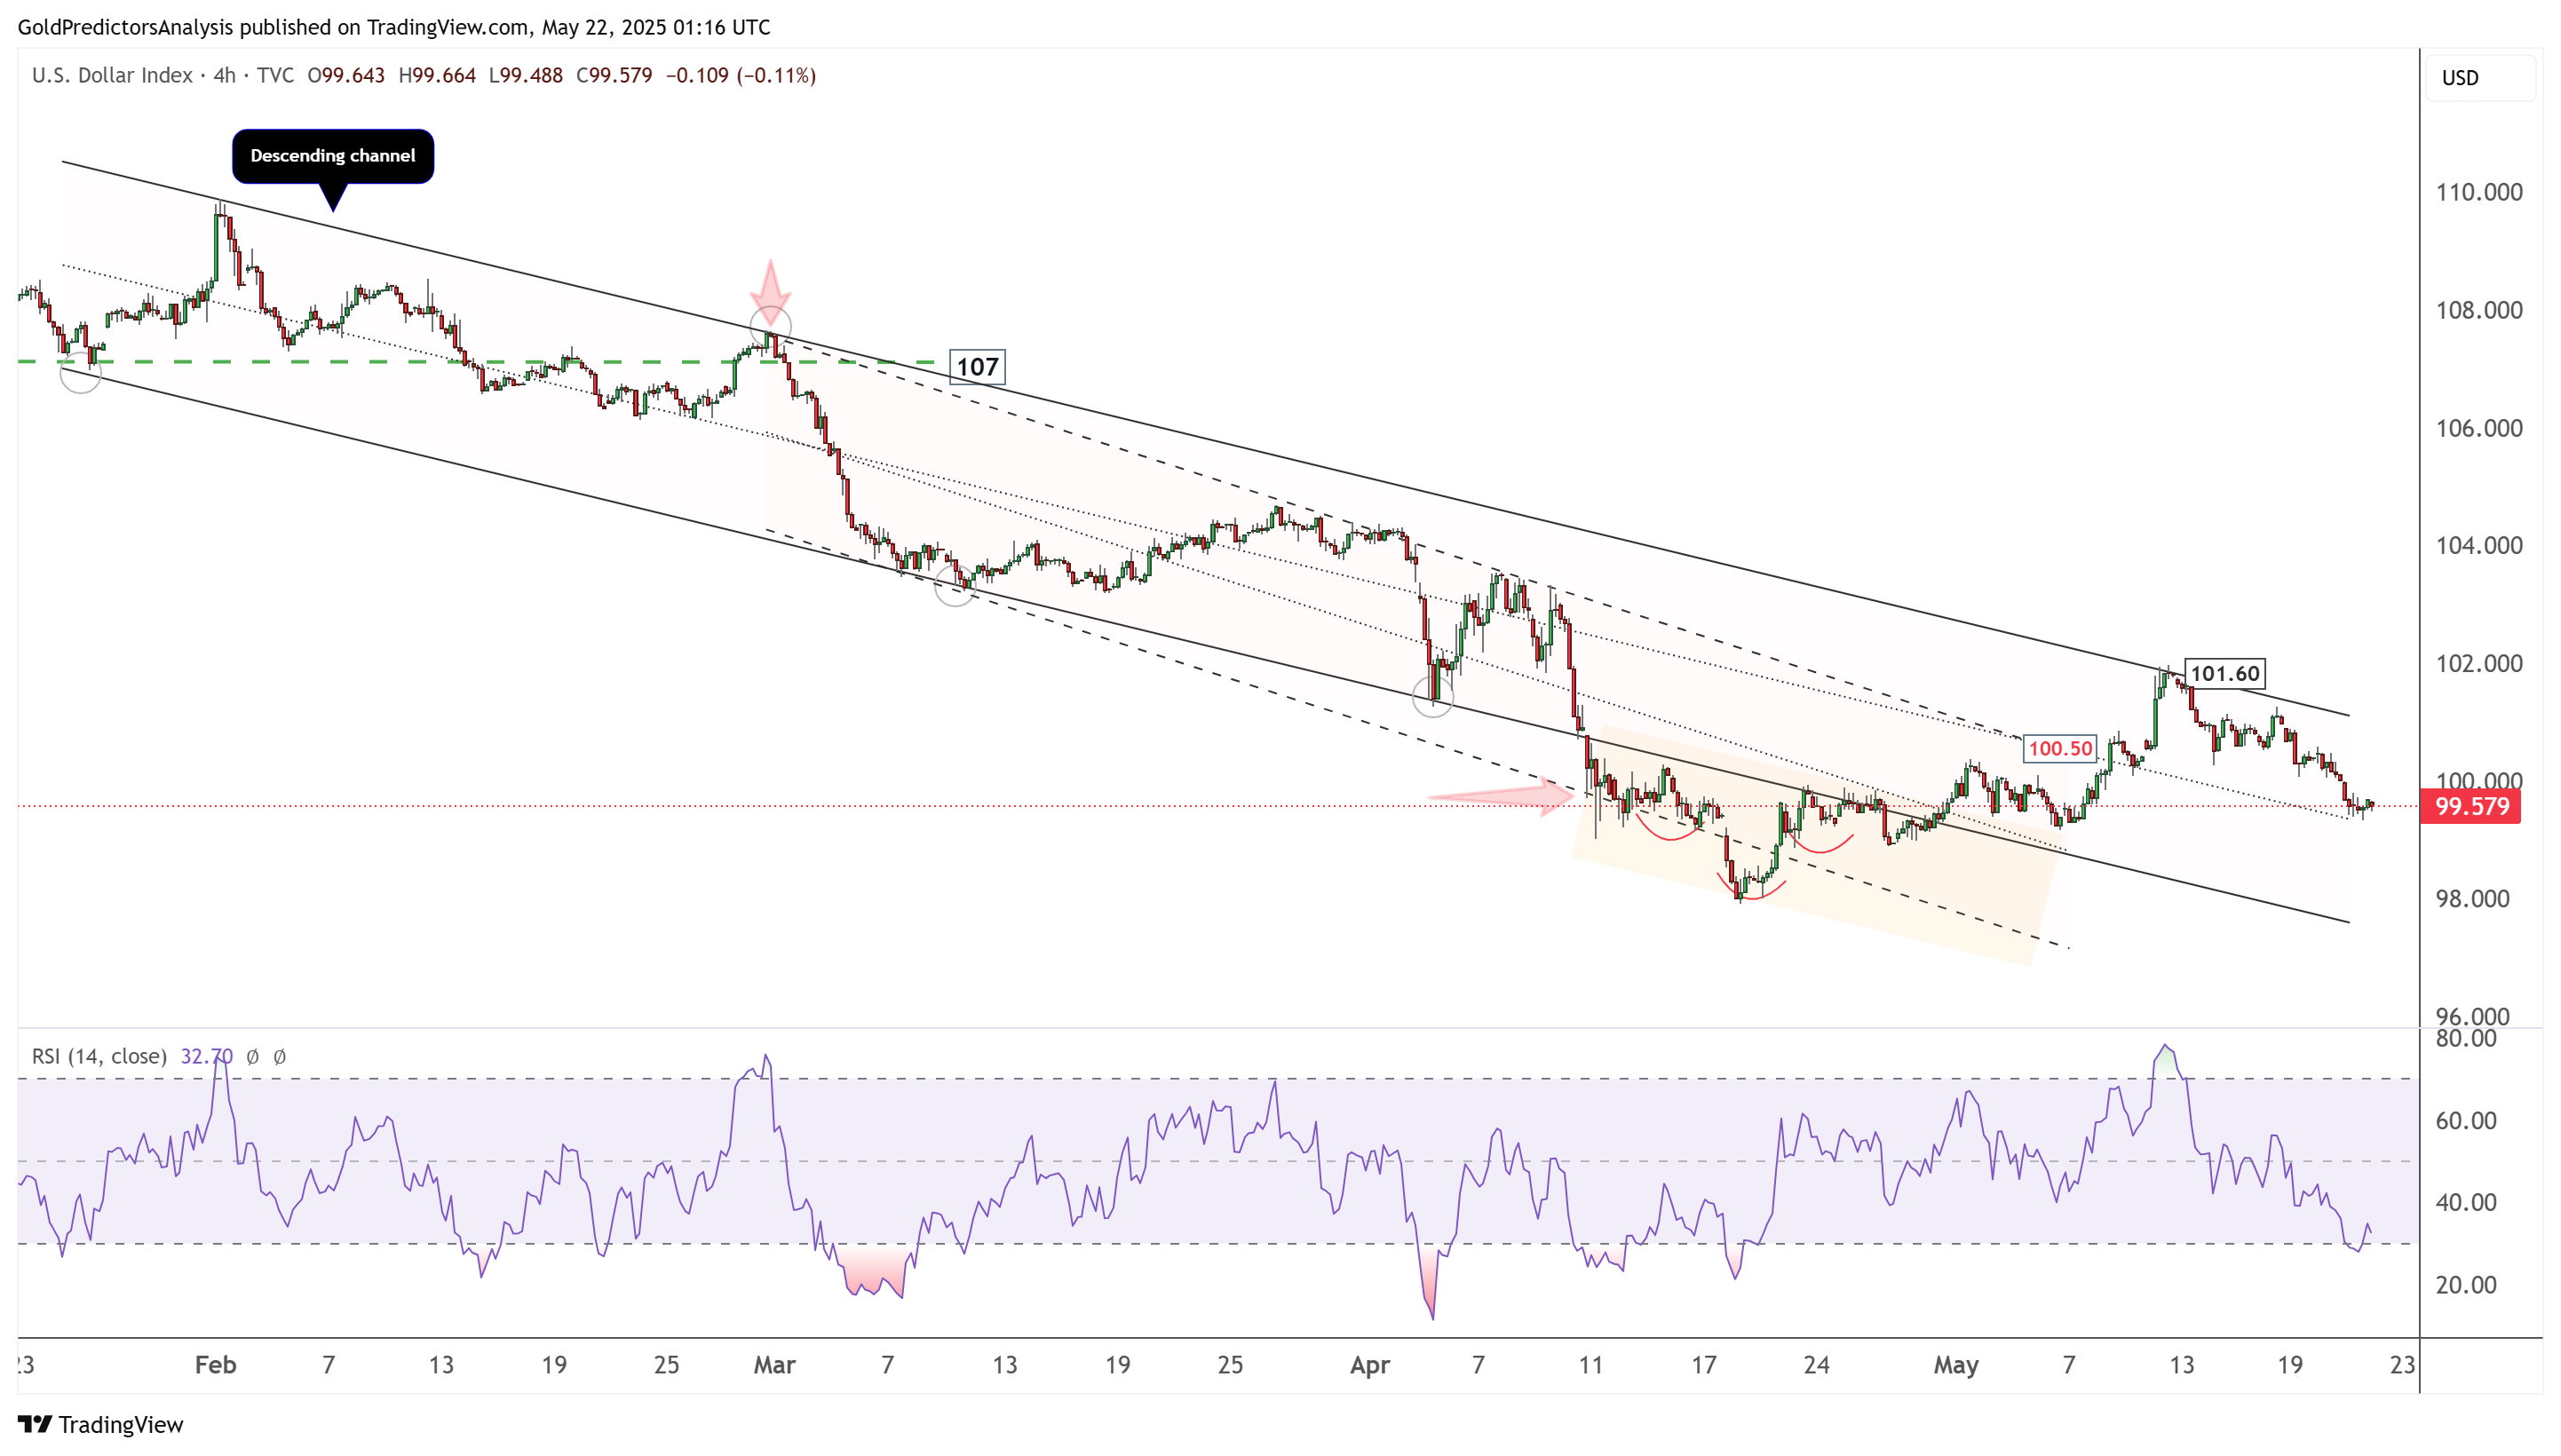
US Dollar 4-Hour Chart – Bearish Pressure
The 4-hour chart for the US Dollar Index shows that it trades within a descending channel. The index recently hit strong resistance at 101.60, near the channel’s upper boundary. The failure to break above the 102 level indicates continued bearish momentum, with a likely move toward the 98 level.
About the Author
Bob MasonChief Crypto Boss
123456789 30 He has written extensively for a broader audience and his current focus is on developments relating to the financial markets including, but not limited to currencies, commodities, alternative asset classes, and global equities.


Advertisement