
Advertisement
Advertisement
Natural Gas Price Forecast: Gas Faces Resistance After Bullish Breakout Attempt
By:
A failed breakout above the 20-Day MA may lead to short-term weakness, though broader bullish signals remain from higher swing lows and key moving averages.
Natural gas showed strength earlier in Wednesday’s session as it advanced above Tuesday’s high and the 20-Day MA before hitting resistance with a high of $3.51. The 20-Day line was reclaimed yesterday with strength confirmed by a daily close slightly above the line. Today’s advance hit a five-day high and exceeded the 50% retracement. Following the high, sellers quickly took charge and pushed price back below the 20-Day MA, now at $3.43.
At the time of this writing, trading continues in the lower half of the day’s trading range and below the opening price for the session. Therefore, it looks like the day will end with a closing price back below the 20-Day line. Moreover, the day may end with a bearish shooting star candlestick pattern.
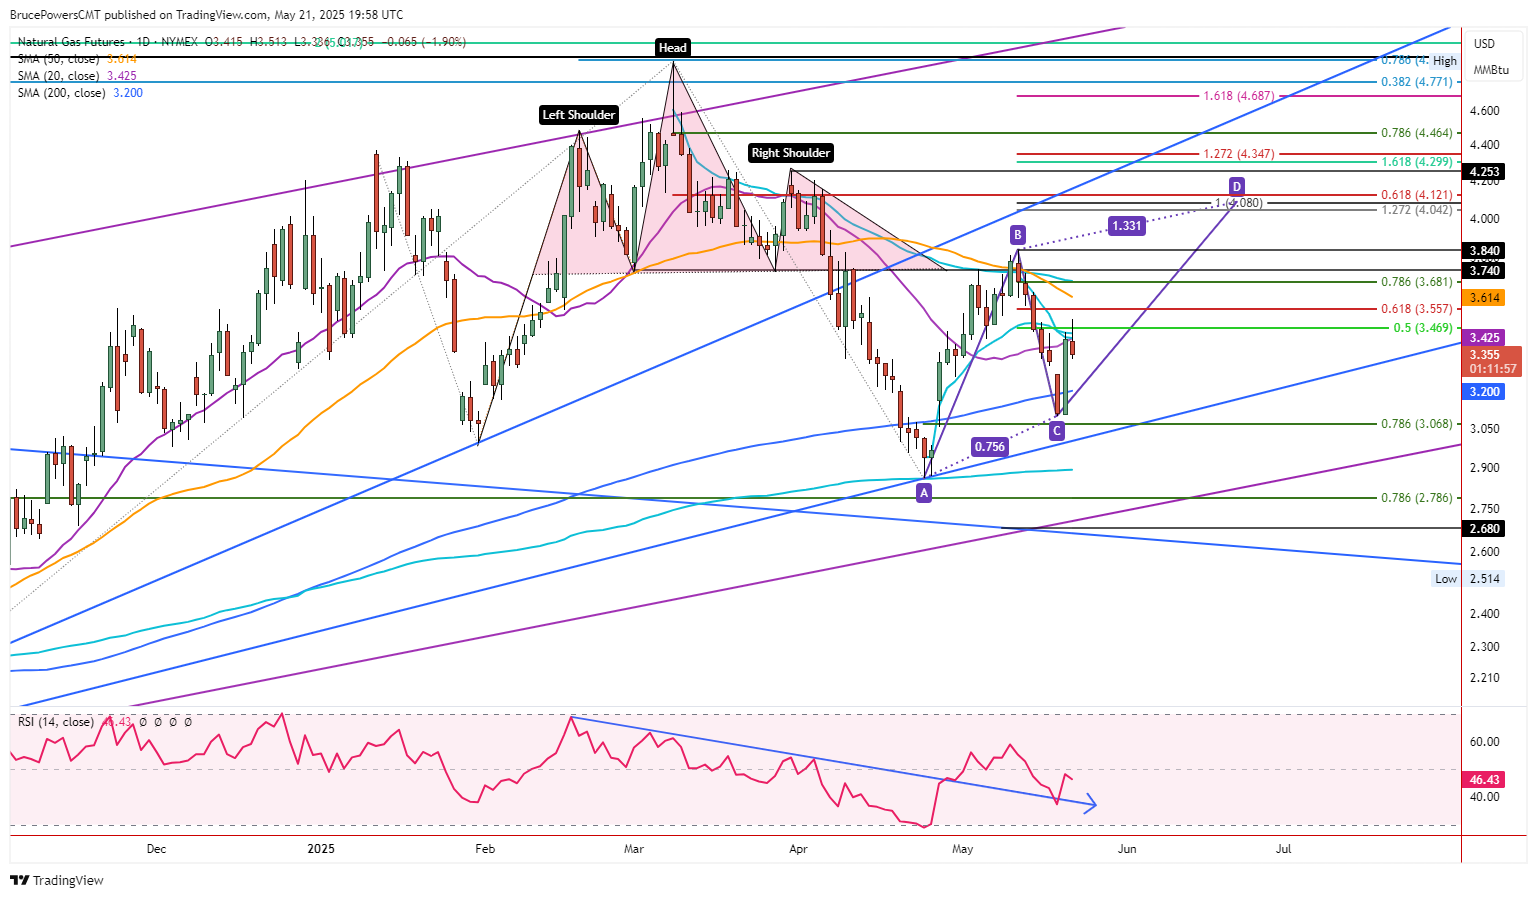
Below $3.31 Targets 200-Day MA at $3.20
Whether that candle pattern occurs or not, a drop through the day’s low of $3.31 will trigger a one-day bearish reversal and a failure to successfully reclaim the 20-Day MA. Nonetheless, key support is around the 200-Day MA, now at $3.20, and the recent higher swing low at $3.10 (C). Given a sharp one-day bullish reversal that triggered yesterday, a minor pullback before moving higher would be healthy for the advance that began from the April swing low (A).
Higher Swing Low Following Strong Support
A higher swing low was recently established following a successful test around the 200-Day MA. Although natural gas dipped briefly below the 200-Day line, it quickly recovered, and buyers took charge. In addition, the weekly chart (not shown) had a successful test of the 50-Week MA during the April swing low, and it converged with the 78.6% retracement at $3.07.
Since the 50-Week line was reclaimed in mid-September it has largely represented dynamic support for the trend other than a couple short dips below the line. It provides higher timeframe confirmation that strong support was likely found around the April swing low and that the bull trend should be ready to proceed.
Weekly Bullish Confirmation
This week’s higher swing low provides further evidence for a continuation of the bull trend. Dynamic support is defined by the internal rising trendline that connects to the April swing low. Notice that the slope is higher than the purple trendline that connects to the August swing low and below the trendline line that broke on the bearish head and shoulders pattern trigger.
For a look at all of today’s economic events, check out our economic calendar.
About the Author
Bruce Powerscontributor
Bruce has been involved in the financial markets for over 20 years, as an analyst, trader, educator, and writer.


Advertisement