
Advertisement
Advertisement
Natural Gas and Oil Forecast: WTI Nears $63, Gas Faces $3.75 Hurdle as Market Volatility Builds
By:
Key Points:
- WTI crude nears $63 per barrel, driven by geopolitical tensions and OPEC+ output strategy.
- Natural gas futures stall below $3.75 resistance as technical patterns point to downside risk.
- A weaker US dollar boosts demand for dollar-denominated commodities like oil and natural gas.

Market Overview
WTI crude oil futures rose to $63.00 per barrel, extending a two-day rally fueled by geopolitical tensions that continue to rattle energy markets. The protracted conflict and recent escalations have stoked concerns over supply disruption, especially as OPEC+ maintained its planned production increases for July, easing worries of a glut.
Simultaneously, a weakening US dollar, pressured by global trade frictions, has increased the appeal of dollar-priced commodities, such as crude oil.
This combination of factors—limited supply expansion, currency shifts, and geopolitical uncertainty—has contributed to sustained volatility in oil and natural gas prices, reflecting a complex interplay of market forces.
Natural Gas Price Forecast
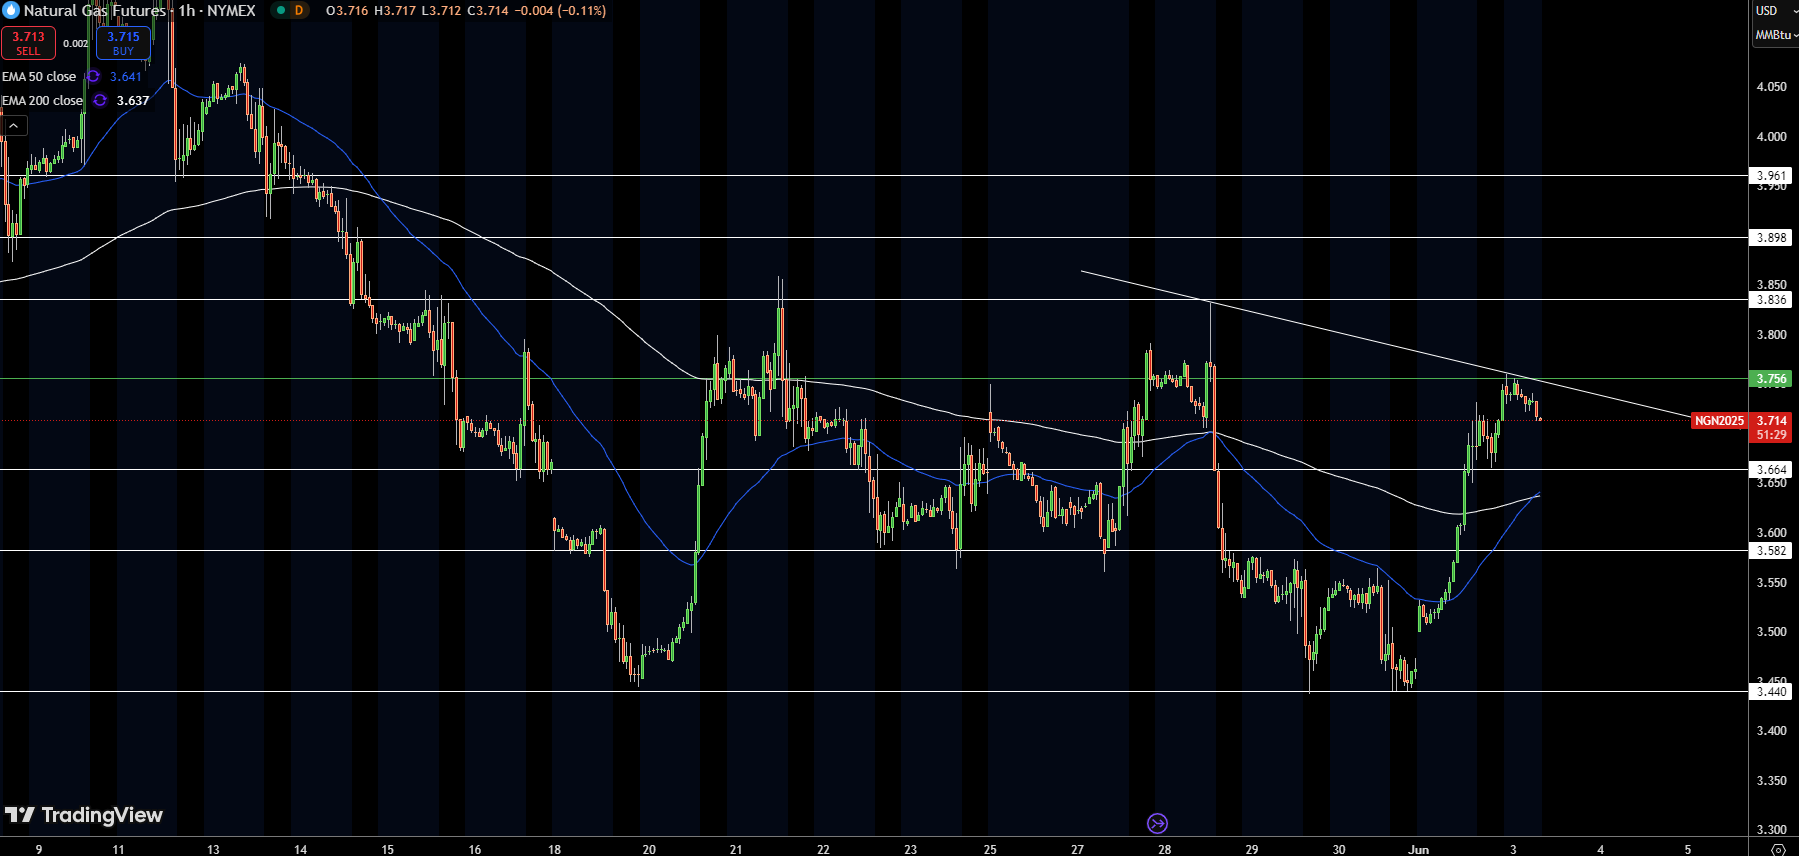
Natural Gas Futures (NGN2025) are consolidating below the $3.75 resistance, where a descending trendline converges with horizontal levels. The price faces downward pressure, with the 50-period EMA at $3.64 and the 200-period EMA around $3.64 offering nearby support.
The price action shows a sharp rejection from $3.75, hinting at potential downside momentum.
If selling pressure continues, a breakdown below $3.66 could open the door for a move toward $3.58 or even $3.44. However, if the price manages to break decisively above $3.75, there is room to target higher resistance around $3.83.
WTI Oil Price Forecast
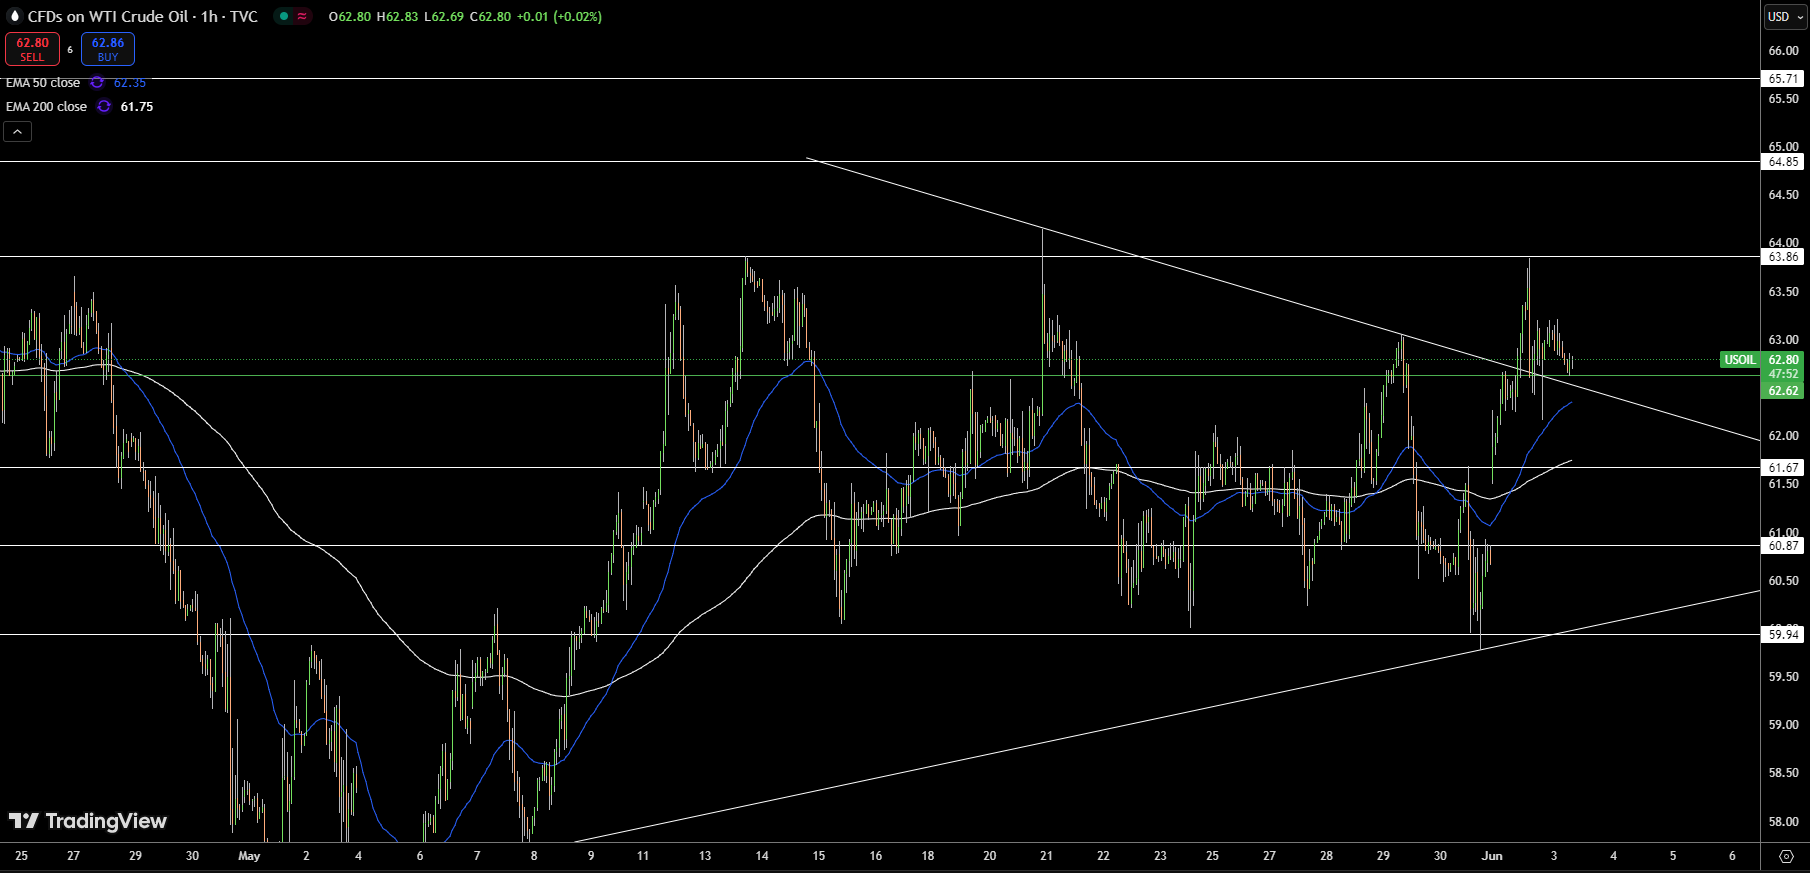
WTI crude oil is consolidating just below the $63.00 resistance, where a descending trendline converges with horizontal resistance levels. The 50-period EMA near $62.95 and the 200-period EMA around $61.75 provide immediate dynamic support.
Price action remains constrained within a tightening range, hinting at an impending breakout or breakdown. A confirmed close above $63.00 could trigger a move toward $64.85, while failure to hold this level may see a retreat toward $61.67 or even $60.87.
Brent Oil Price Forecast
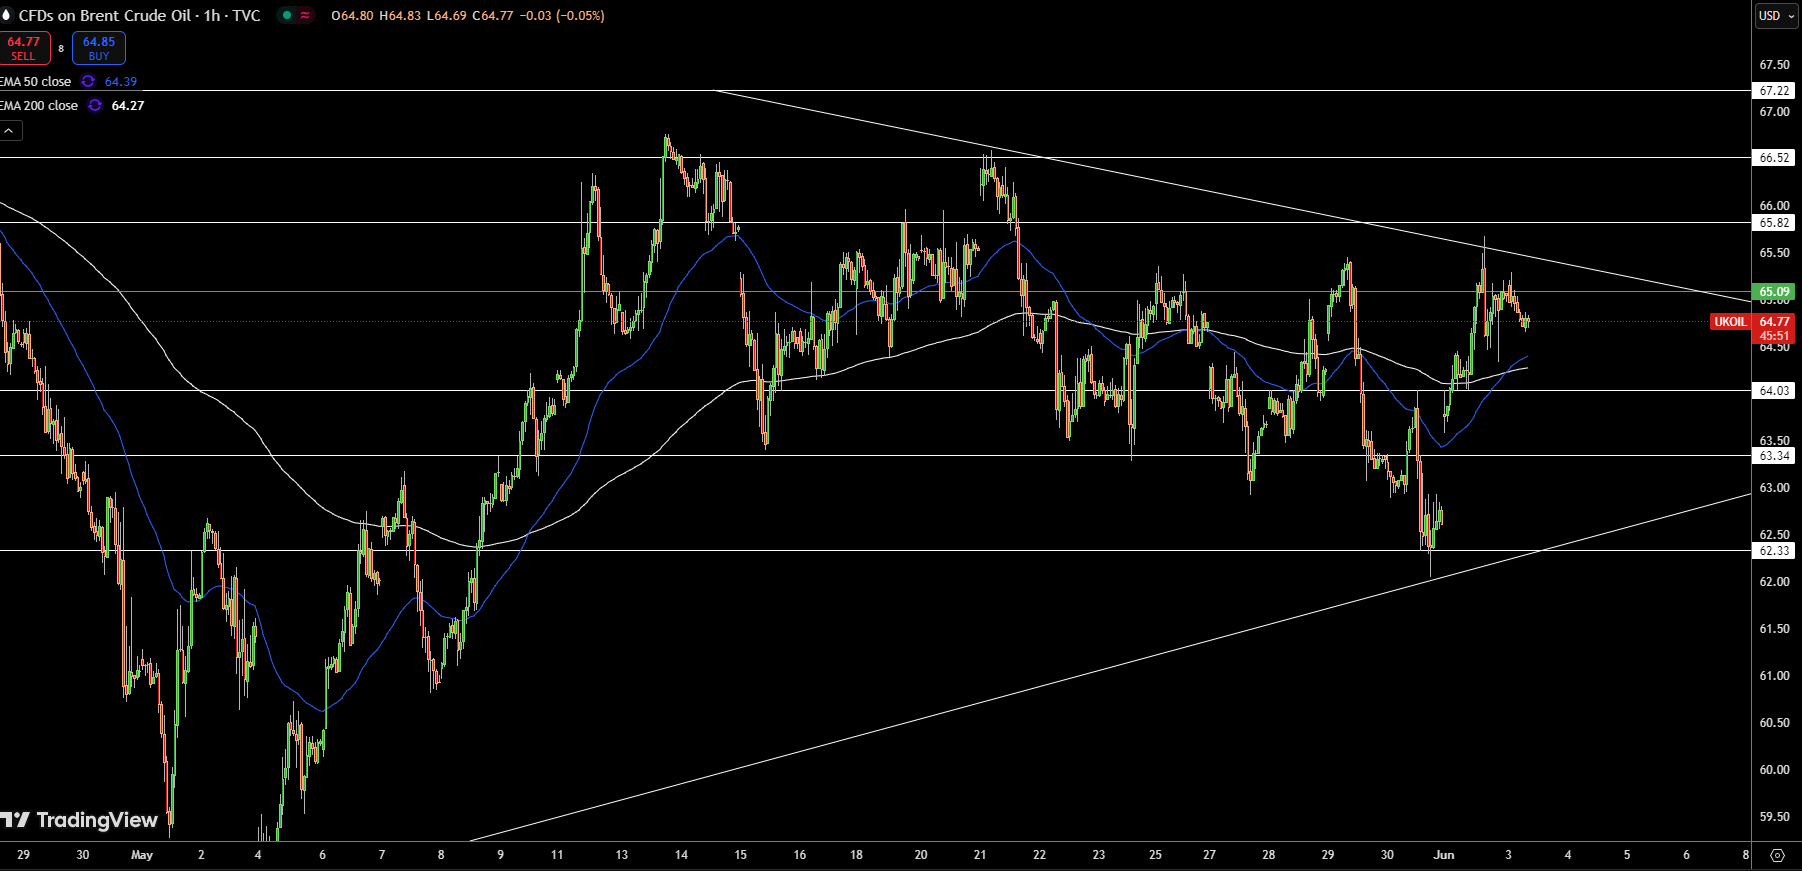
Brent Crude Oil is consolidating below the $65.82 resistance, marked by a descending trendline that intersects horizontal resistance levels. The price is supported by the 50-period EMA at around $64.39 and the 200-period EMA near $64.27, both of which offer dynamic support.
If UKOIL can sustain a breakout above $65.82, it could target higher resistance levels around $66.52 and $67.22. However, failure to clear this barrier could result in a pullback toward $64.03 or even $63.34. The overall pattern suggests tightening price action within a larger wedge, hinting at a potential decisive move.
About the Author
Bob MasonChief Crypto Boss
123456789 30 He has written extensively for a broader audience and his current focus is on developments relating to the financial markets including, but not limited to currencies, commodities, alternative asset classes, and global equities.


Advertisement