
Advertisement
Advertisement
AUD/USD, NZD/USD, and USD/JPY Analysis as US Dollar Weakens and Trade Tensions Rise
By:
Key Points:
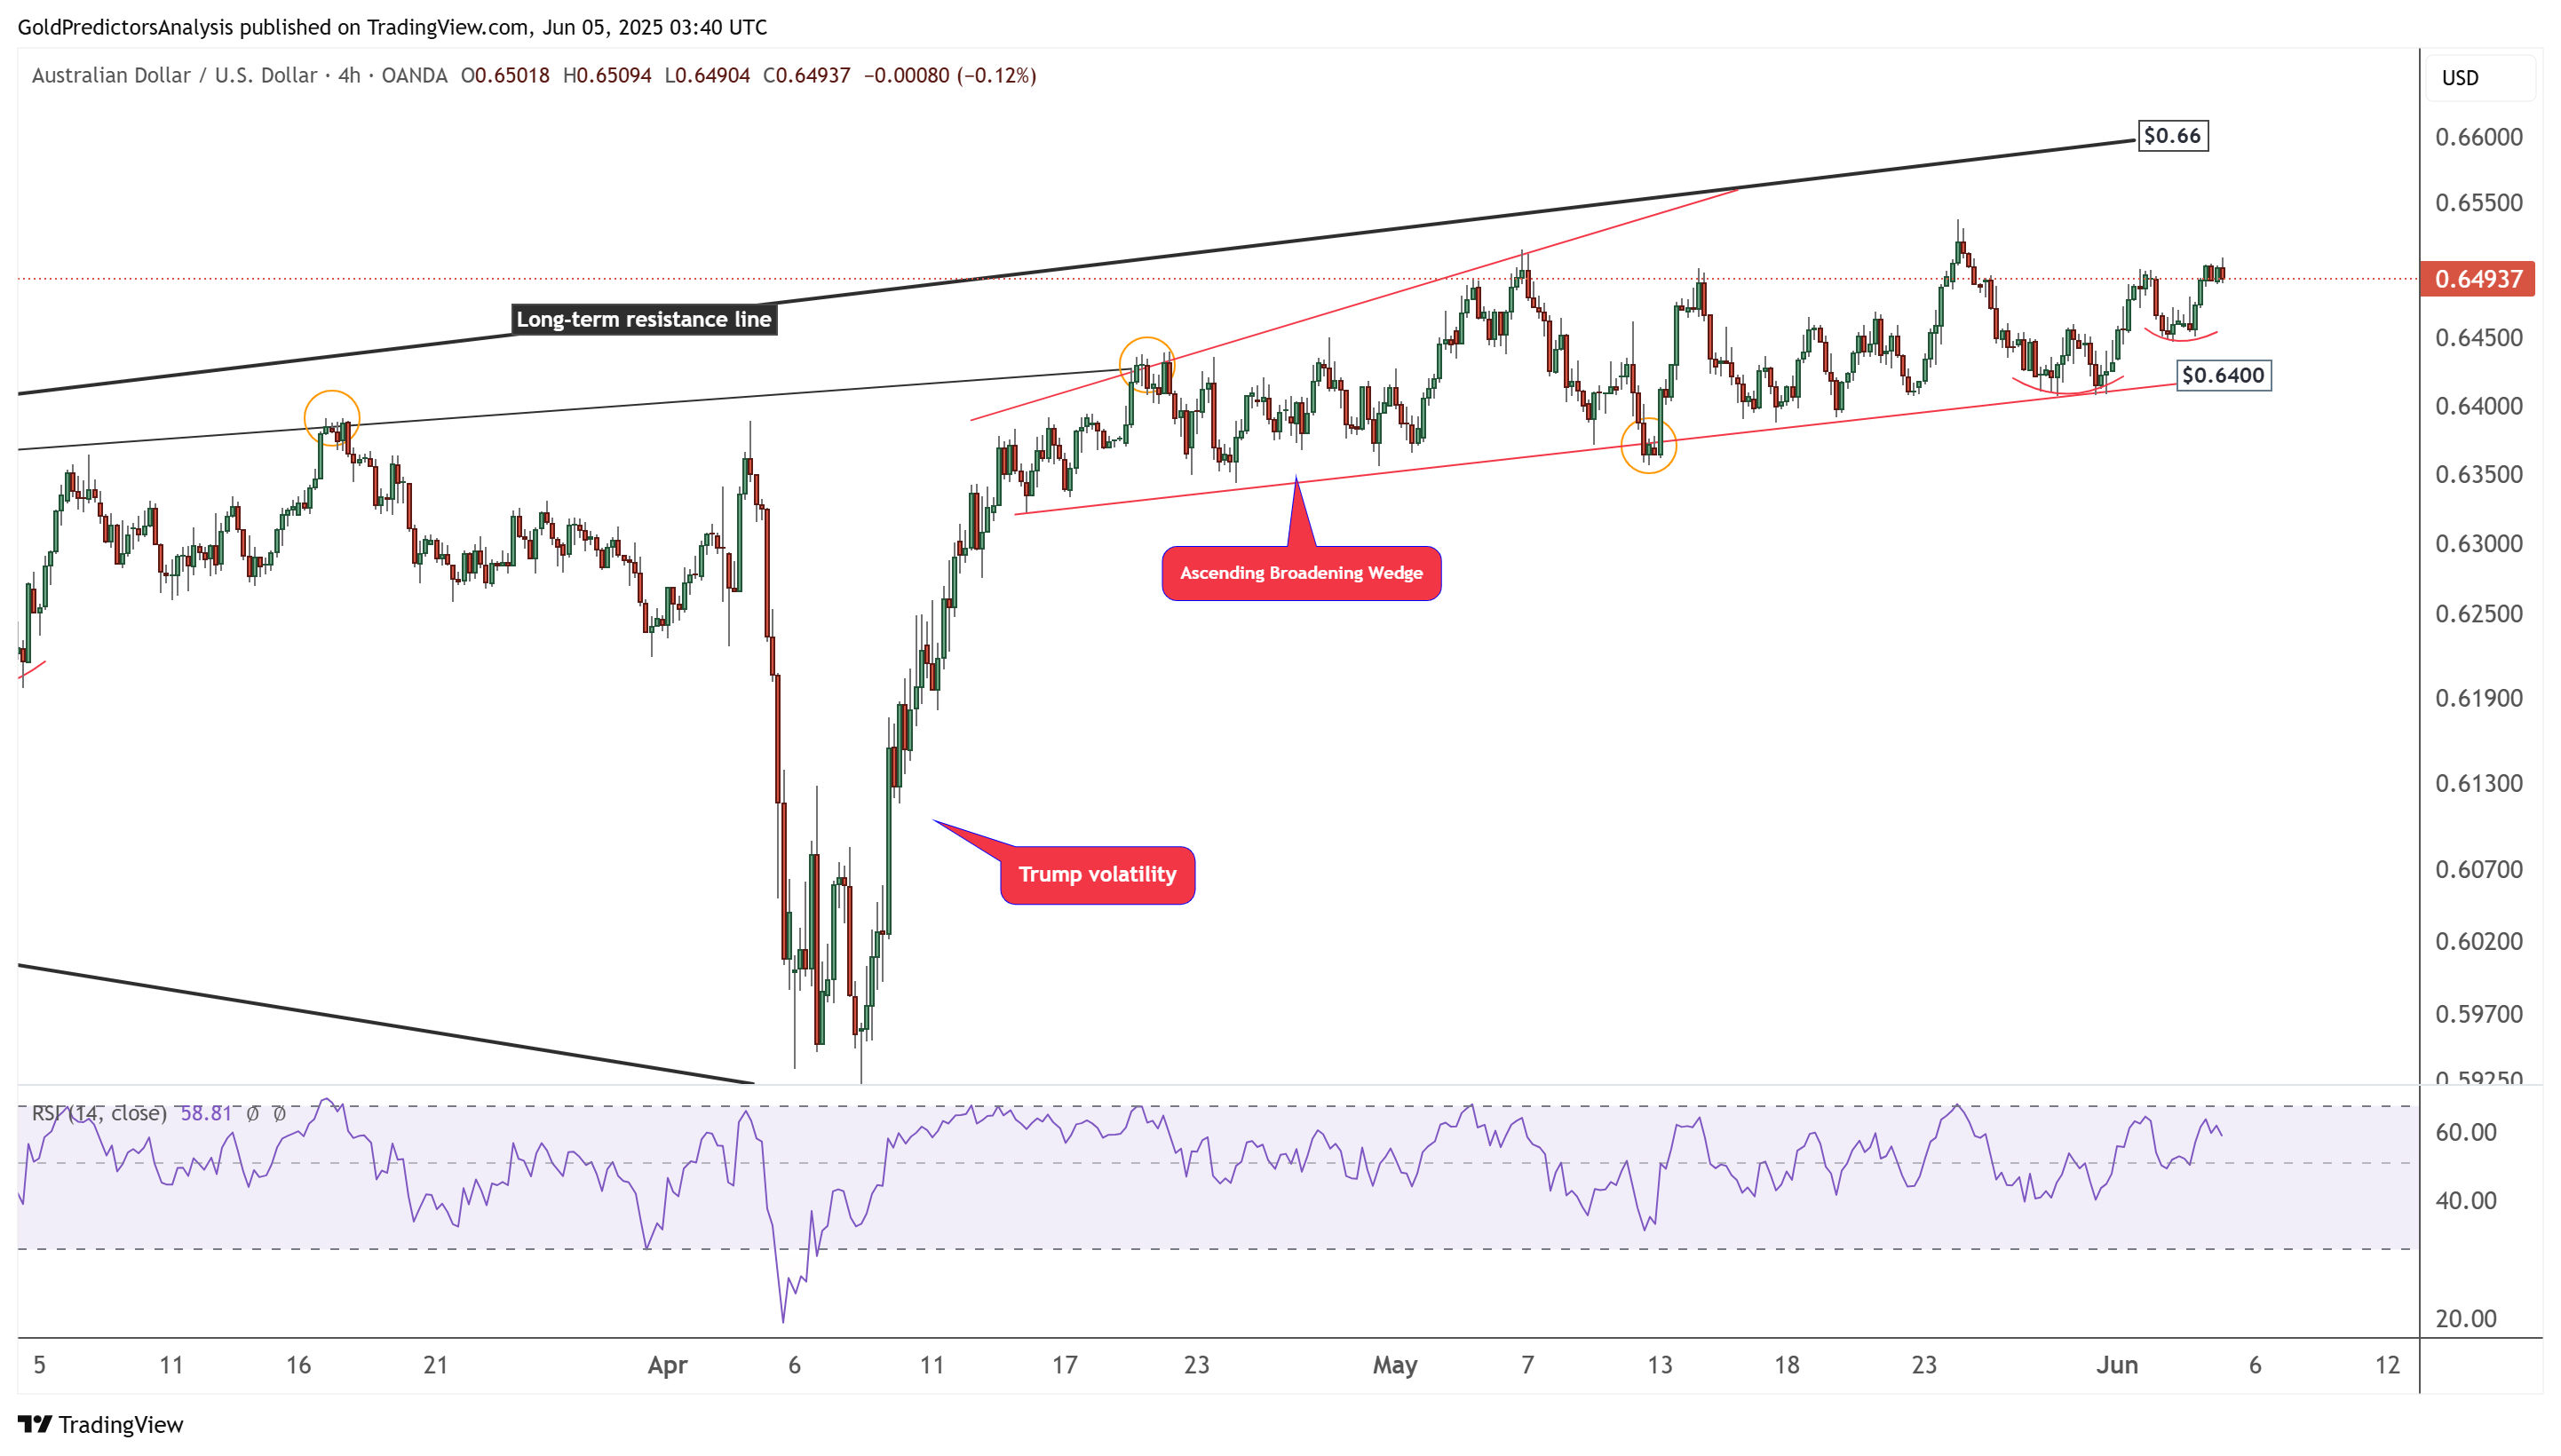
- AUD/USD builds bullish momentum and eyes the $0.66 level.
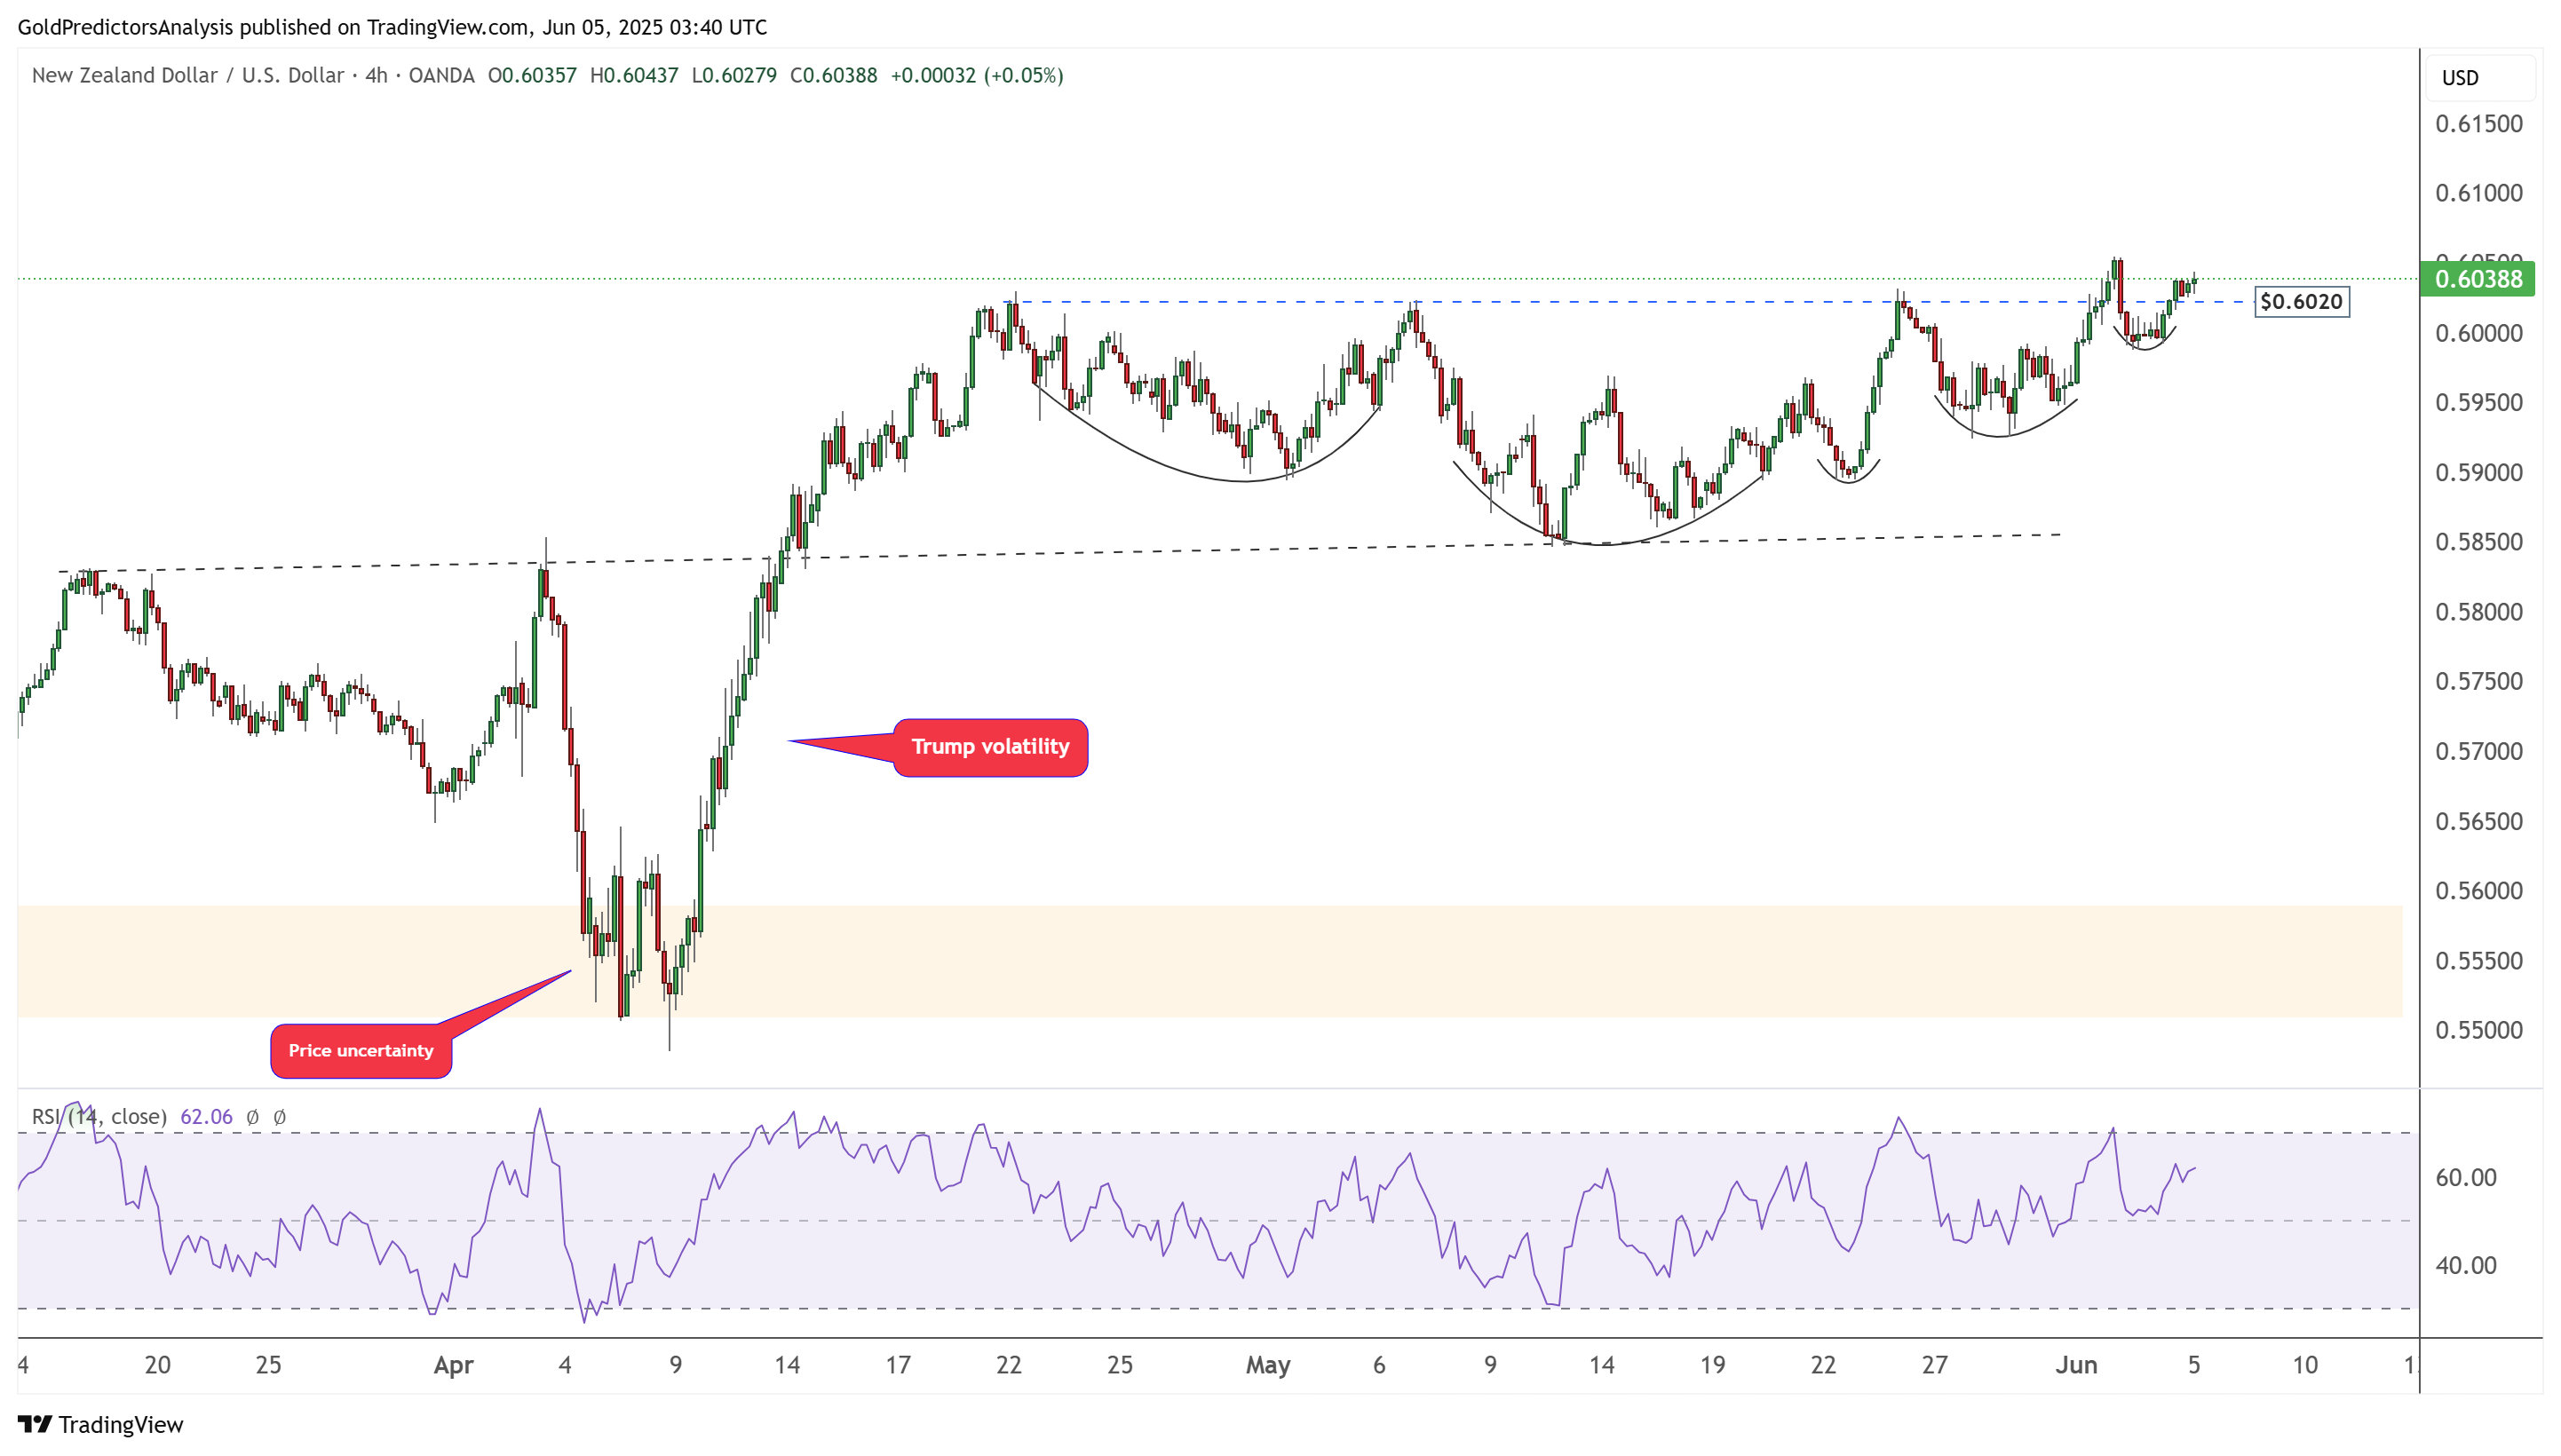
- NZD/USD breaks above $0.6020 and targets further upside.
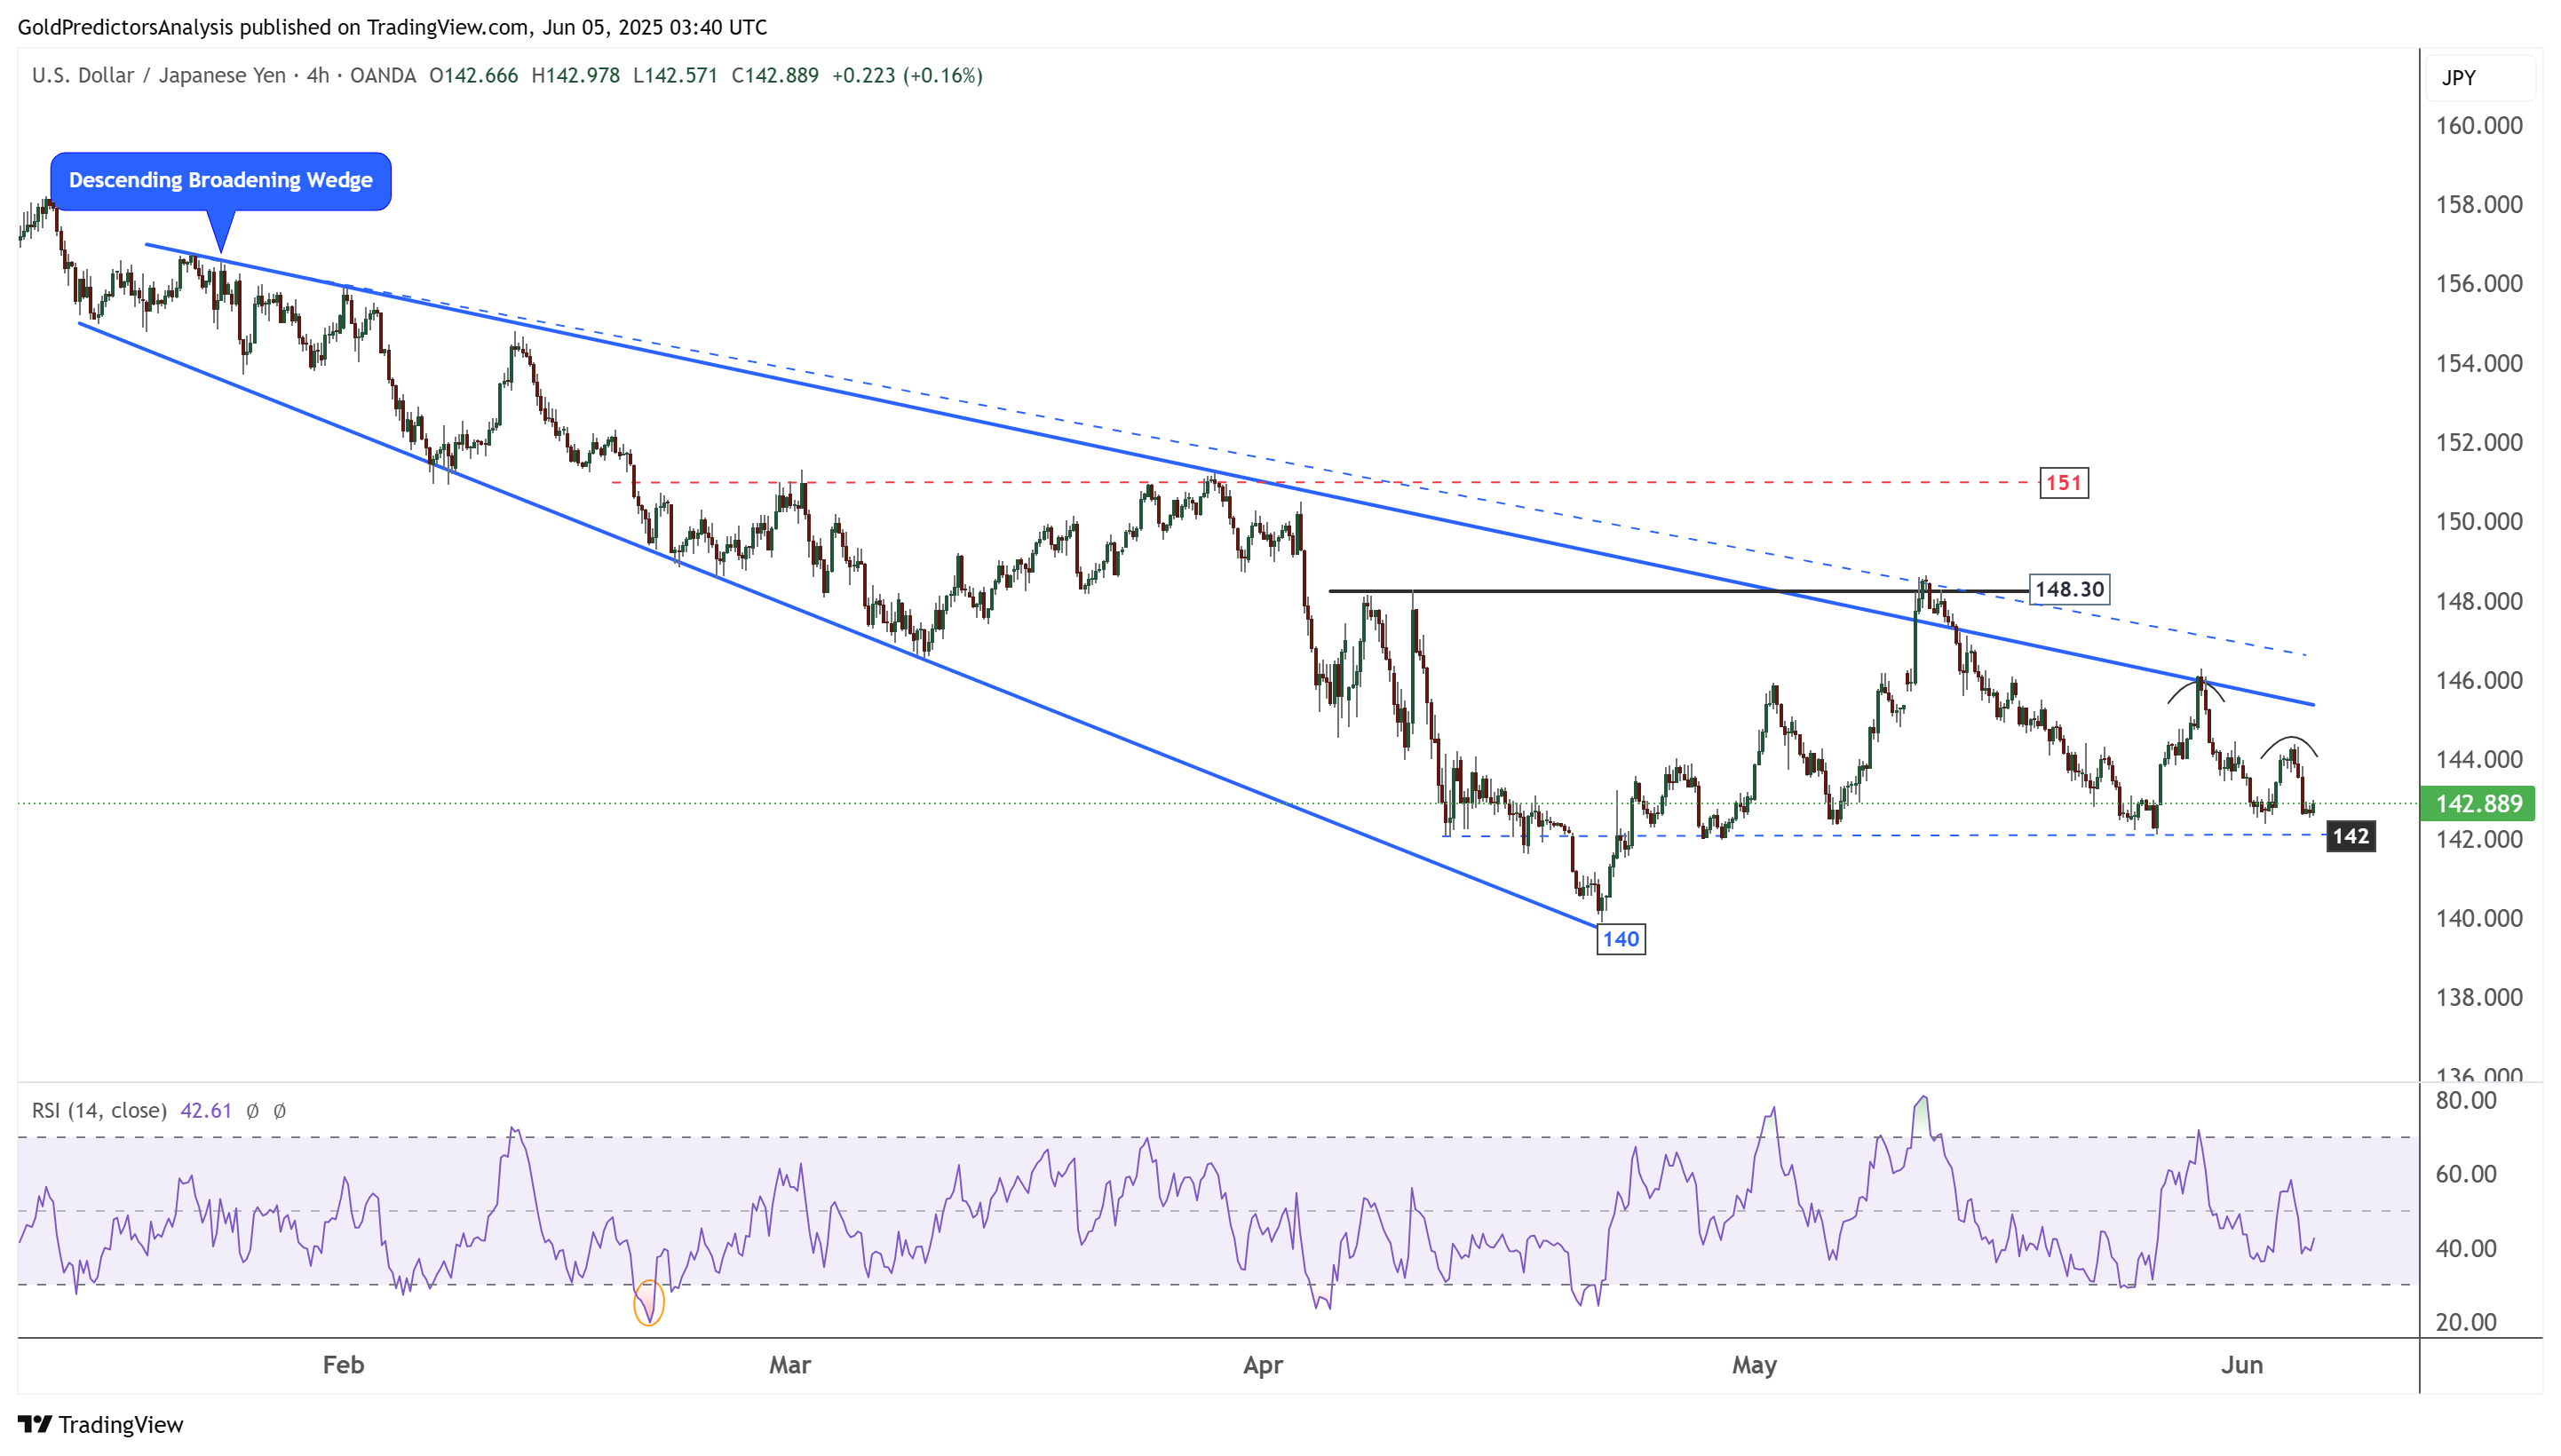
- USD/JPY approaches 142 and signals potential for further downside.

Australian Dollar Gains Despite Trade Tensions and US Weakness
The Australian Dollar rose for the second session in a row. It held its ground despite a weaker-than-expected trade surplus. Australia posted a $5,413 million trade surplus in April, down from $6,892 million in March, as shown in the chart below.
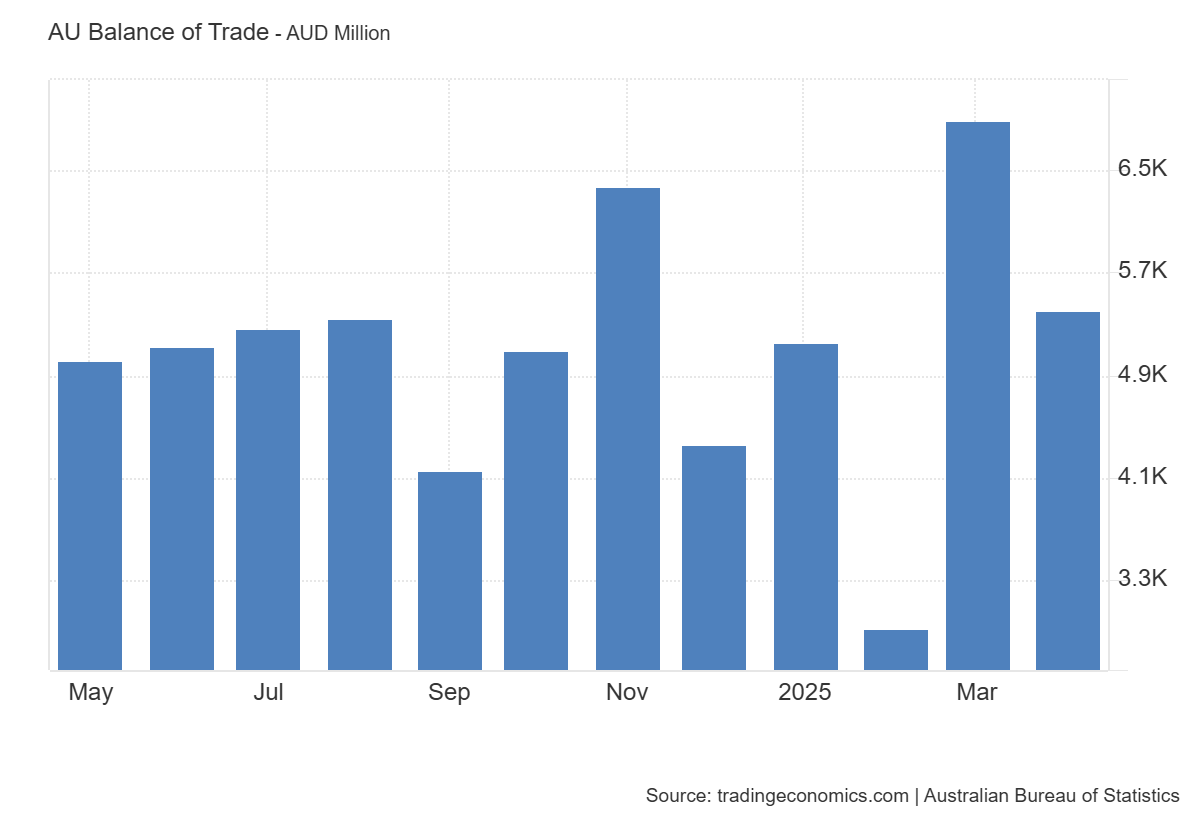
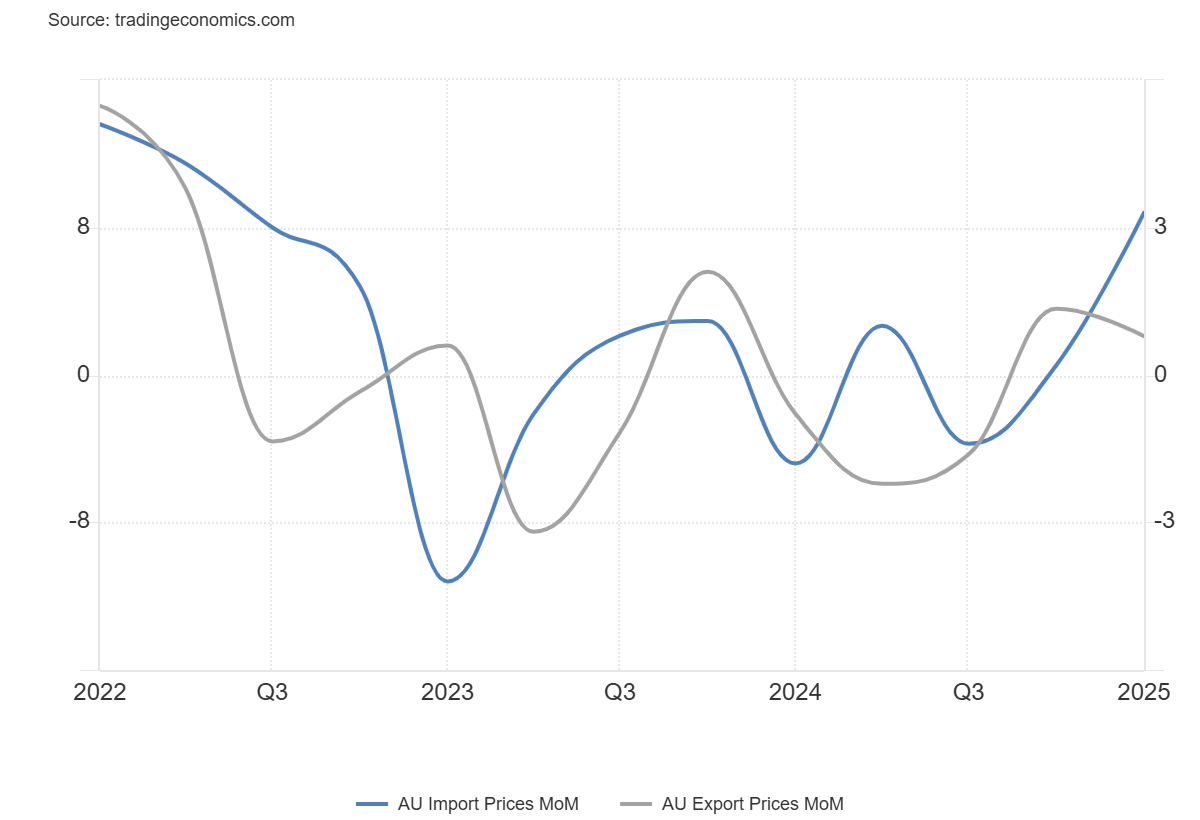
The chart below shows that the exports declined by 2.1%, while imports rose by 3.3%. These figures signalled slowing trade momentum but failed to shake the AUD.
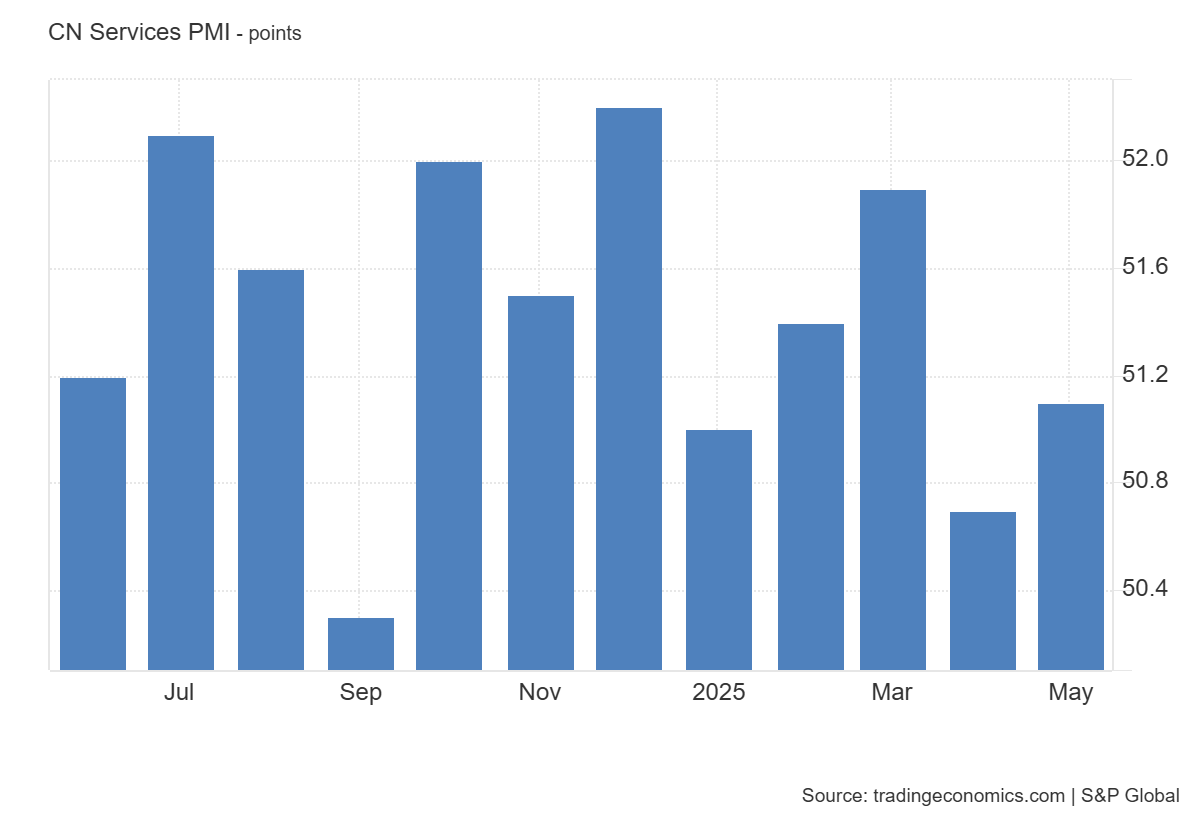
Moreover, the support came from China’s Services PMI, which improved to 51.1 in May from 50.7. Due to close trade ties, the Aussie Dollar often reacts to Chinese data. Despite falling exports, the better Chinese services data supported the AUD. Local services and GDP data remained mixed, suggesting economic fragility.
The Reserve Bank of Australia maintained a cautious tone. Policymakers noted that global trade risks had not yet hurt Australia. However, they acknowledged that uncertainty could limit growth. RBA minutes and comments from officials point to a wait-and-see stance. Rate cuts remain possible but not immediate, helping support the AUD.
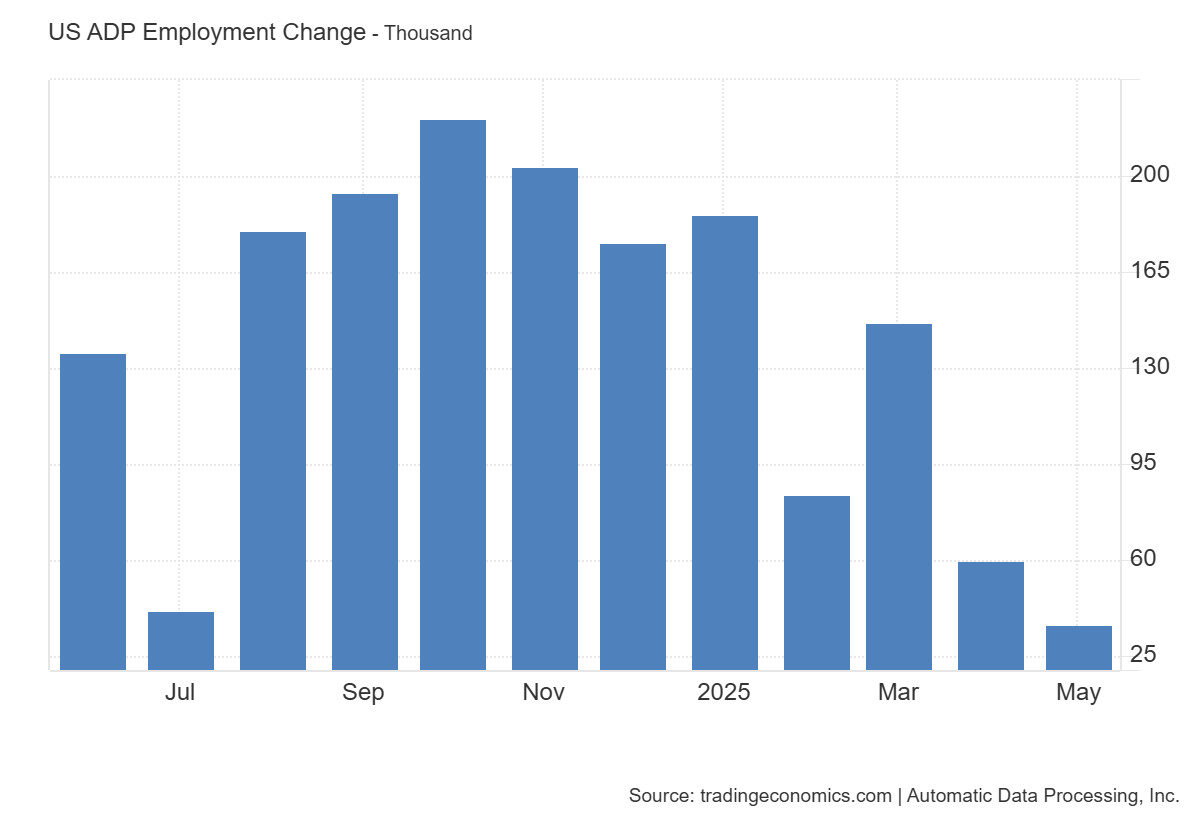
The weaker US economic data added fuel to AUD/USD gains. The US ISM Services PMI dropped to 49.9, missing expectations. Moreover, ADP jobs data also came in weak, with just 37,000 new jobs in May. These signs of a US economic slowdown pressured the dollar. Traders also worry that US fiscal policy may worsen inflation and debt conditions.
USDJPY Declines as Economic Concerns and Policy Risks Mount
The Japanese Yen gained as the US Dollar continued to weaken. USD/JPY moved lower after repeated failures to stay above 148.30. The pair is now approaching the 142 support zone. Market sentiment shifted due to poor US data and rising political risks.
Concerns over US trade policy also weighed on the dollar. President Trump’s tariff hikes on metals raised fears of a global slowdown. These risks drove traders toward safe-haven assets like the Yen. China’s response and the brewing trade dispute added to uncertainty.
Japan’s relatively stable macro environment helped the Yen. Despite global pressure, Japan has avoided sharp policy shifts. The Bank of Japan remains patient, and inflation is stable. This keeps USD/JPY sensitive to broader risk sentiment and US policy changes. A break below 142 may lead the pair toward 140 in the coming sessions.
AUD/USD Technical Analysis – Ascending Broadening Wedge Pattern
The 4-hour chart for AUD/USD shows that the pair is trading within an ascending broadening wedge pattern. The formation of strong support near the $0.6400 area indicates a likely continuation toward $0.6600. The weakness in the US Dollar Index is driving AUD/USD higher.
NZD/USD Technical Analysis – Bullish Price Action
NZD/USD shows the formation of a bullish price structure above the $0.5850 area. This bullish setup suggests the pair will likely continue moving higher. The upward momentum is also supported by weakness in the US Dollar Index. A break above $0.6020 would confirm a move toward higher levels.
USD/JPY Technical Analysis – Descending Broadening Wedge
The 4-hour chart for USD/JPY shows that the pair is trading within a descending broadening wedge pattern. The pair failed at 148.30 and continued to move lower. Each rebound has also failed at the pattern’s resistance, reinforcing the downside trend.
The 142 level is currently supporting, preventing a deeper decline. However, repeated failed rebounds have formed bearish price action. A break below 142 would signal further downside toward 140, confirm strong bearish pressure, and extend the decline in USD/JPY.
About the Author
Bob MasonChief Crypto Boss
123456789 30 He has written extensively for a broader audience and his current focus is on developments relating to the financial markets including, but not limited to currencies, commodities, alternative asset classes, and global equities.


Advertisement