
Advertisement
Advertisement
Natural Gas News: Prices Struggle After EIA Inventory Spike and Weak Demand Today
By:
Key Points:
- Natural gas futures hold near 200-day moving average as traders weigh bearish storage data against short-term weather-driven demand.
- A 122 Bcf inventory build—well above estimates—pressures prices and confirms adequate U.S. natural gas supply.
- Resistance at $3.791 to $3.900 limits upside; technicals point to continued “sell the rally” trading behavior.

Natural Gas Slips After Bearish Storage Data but Finds Technical Support Near 200-Day Moving Average
U.S. natural gas futures extended losses into early Friday but showed signs of stabilization as traders tested key technical levels and weighed bearish storage data against supportive weather patterns and short-term supply fundamentals. The July contract has been in retreat since midweek, now holding just above the 200-day moving average at $3.556—a critical level that continues to underpin near-term sentiment.
At 13:34 GMT, Natural Gas Futures are trading $3.708, up $0.031 or +0.84%.
Can the 200-Day Moving Average Hold as Bulls Attempt to Regain Ground?
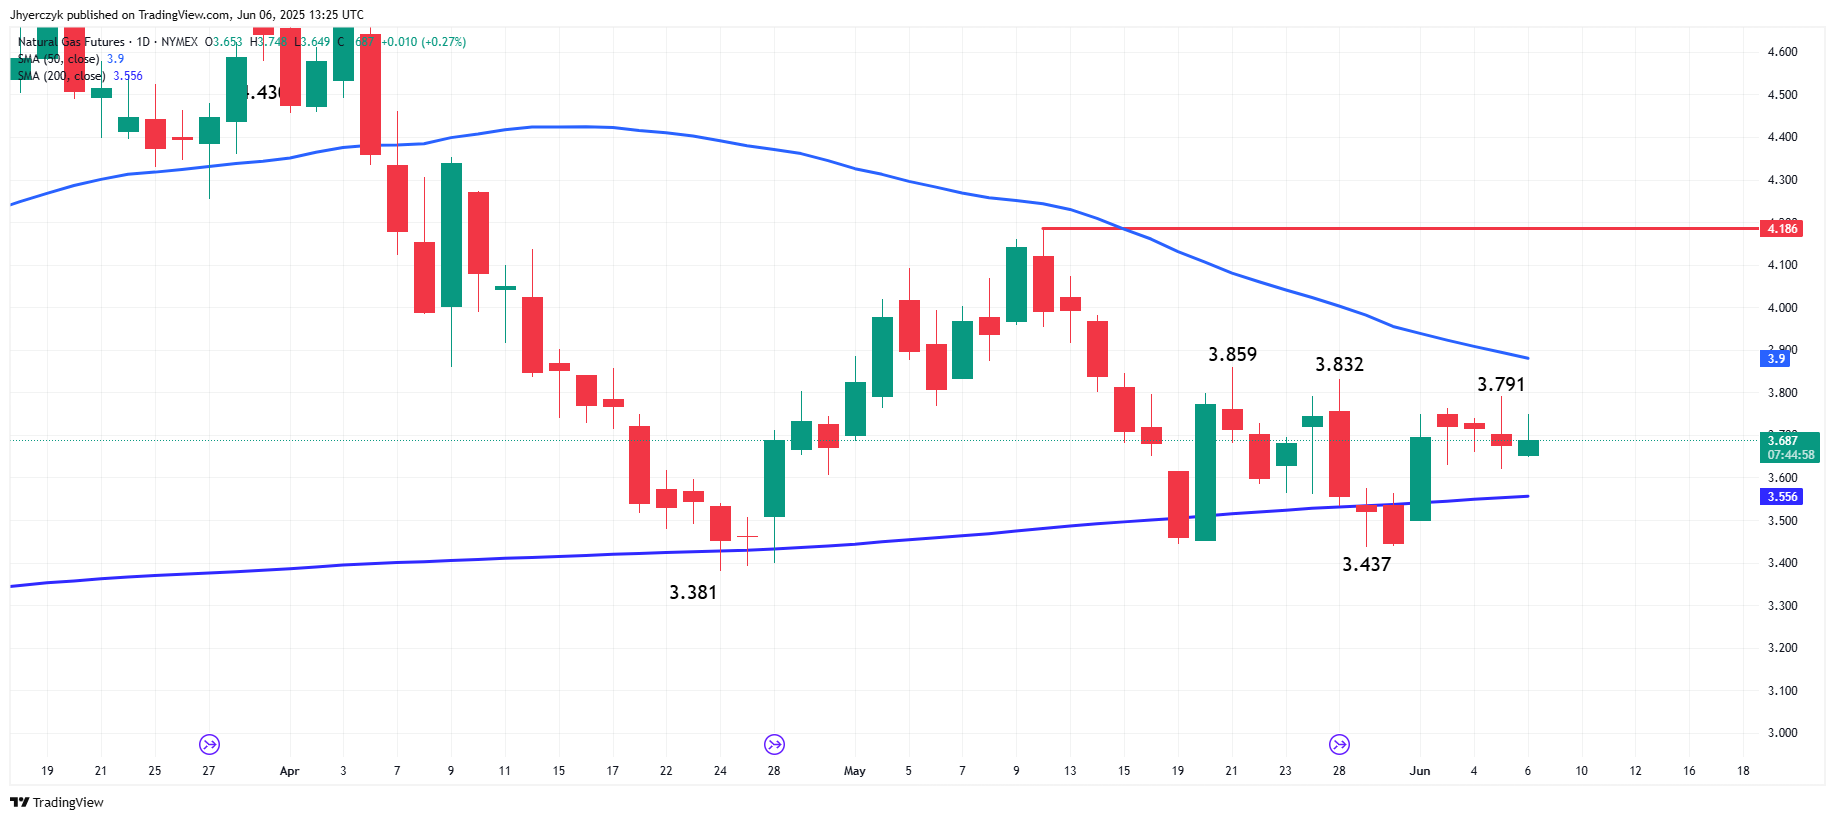
Despite a three-day slide, buyers appeared near the 200-day moving average, sparking intraday short-covering rallies. However, each bounce has been met with renewed selling interest, confirming a “sell the rally” pattern. Technical resistance remains layered between $3.791 and $3.859, but a true trend reversal would require a close above the 50-day moving average at $3.900. Unless that threshold is breached, upward momentum remains limited.
Did the EIA Storage Report Tip the Market Bearish Again?
Thursday’s EIA report added bearish weight. Working gas in storage increased by 122 Bcf for the week ended May 30, well above consensus estimates of +113 Bcf and the five-year average injection of +98 Bcf. Total stocks now stand at 2,598 Bcf, up 4.7% versus the five-year norm and down 10% year-on-year. Regionally, the Midwest and South Central posted notable builds, reflecting strong injections in the nonsalt storage category. The data points to more than adequate supply levels heading into the heart of summer demand season.
Will Weather and Demand Trends Support a Recovery in Prices?
According to NatGasWeather, models show pockets of supportive demand. NatGasWeather forecasts warm to hot temperatures across the South, Southwest, and California, with highs reaching the 90s and 100s. However, large parts of the Midwest and Ohio Valley remain cooler, leading to only moderate overall demand through June 11.
On the supply side, dry gas production stood at 105 Bcf/d on Thursday, up 3.1% year-over-year, while total Lower-48 demand was down 2.7% to 70.4 Bcf/d. LNG feedgas flows fell to 13.4 Bcf/d, down 6.4% week-over-week, further softening the bullish case.
What’s the Trading Outlook from Here?
Given the failure to generate lasting upside momentum despite oversold conditions and heat-driven demand pockets, the bias remains slightly bearish heading into next week.
The 200-day moving average at $3.556 is the near-term line in the sand. A firm breakdown below this level would confirm a longer-term bearish shift. Until prices can reclaim the 50-day MA at $3.900, rallies are likely to be sold.
Traders should expect choppy action within this technical range, with sellers still in control unless key resistance levels are cleared.
More Information in our Economic Calendar.
About the Author
James HyerczykProfits & Punchlines
Mr.Hyerczyk is a technical analyst, market researcher, educator and trader. Jim is an expert in the area of patterns, price and time analysis, Forex and stocks.


Advertisement