
Advertisement
Advertisement
Crude Oil Price Forecast: Holds Key Levels Amid Persistent Bearish Pressure
By:
Crude oil trades near support with fading reversal signals, raising the risk of further downside if key technical levels fail to attract buyers.
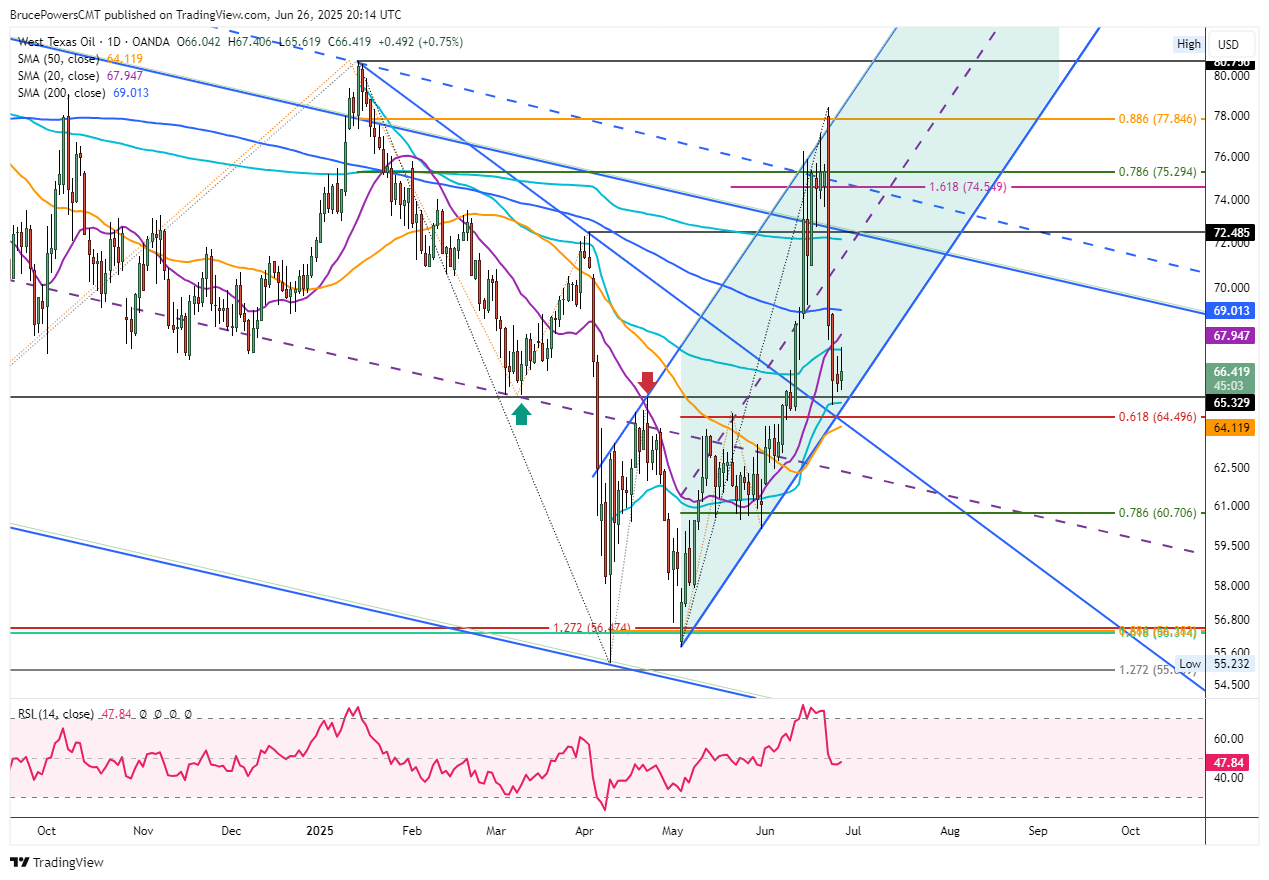
Crude oil continued to show downward pressure on Thursday despite establishing a slightly higher daily high and higher low. This week’s new retracement low of $65.02 found support the neckline of a double bottom pattern and an AVWAP level (light blue) begun from the April trend low. That makes the AVWAP potentially significant as it was anchored from an important trend low.
Trend Channels Provide Clues
The decline completed a 127.2% Fibonacci extension of the 2023 rally and bounced off support of a declining lower trend channel line. Once a reversal occurs from one side of the channel, there is the potential for a move to the other side. That process was completed relatively quickly last Friday, as the top channel line (solid blue) was exceeded and the week ended right at the top channel trendline, indicating that the market recognized the price area.
Downward Pressure Remains
An attempt at a one-day bullish reversal was made today, but it is currently showing signs of failing. A daily close above Wednesday’s high of $67.04 is needed to confirm the one-day breakout and it doesn’t look like that is going to happen. At the time of this writing trading is occurring in the lower half of the day’s relatively narrow price range. The high for the day was $67.41 and the low at $65.62.
Support Near Bottom of Rising Channel
Notice that this week’s low almost reached a trendline that is the bottom of a rising trend channel. The top channel line was confirmed by recent highs. It represented an area of dynamic resistance for seven days recently, including this Monday. Since the price of crude oil seems to be recognizing channels, the current expectation is for an eventual bullish reversal following a test of support near the lower line. Although the top line may be difficult to reach again soon, the center line (dashed) has a greater chance of being reached, if a rally occurs.
50-Day Moving Average is Key
If crude oil continues to test support, it may dip a bit lower. Other price levels to watch for signs of support nearby include the 61.8% Fibonacci retracement at $64.50 and the 50-Day MA, now at $64.12. Following the reclaim of the 50-Day line on June 3, it was recognized as support for the following three days. Therefore, a potential recovery from the current decline becomes less likely if the 50-Day MA fails.
For a look at all of today’s economic events, check out our economic calendar.
About the Author
Bruce Powerscontributor
Bruce has been involved in the financial markets for over 20 years, as an analyst, trader, educator, and writer.


Advertisement