
Advertisement
Advertisement
BTC Price Forecast: BlackRock ETF Demand and Fed Signals Fuel Bullish Momentum
By:
Key Points:
- Bitcoin (BTC) rose to $107,340, nearing its $111,917 all-time high on ETF inflows and Fed rate cut expectations.
- Spot ETF inflows hit $2.2B in one week, led by BlackRock’s IBIT with over $1.3B in net inflows.
- Bitcoin’s near-term path depends on Fed policy cues, geopolitical risks, legislation, and ETF momentum.

Bitcoin Eyes $112K on Fed Cut Bets and ETF Frenzy
Bitcoin (BTC) rose 0.2% on Saturday, June 28, building on Friday’s 0.15% gain and closing at $107,340. While trailing the broader market’s 0.59% rise, growing investor confidence is pushing BTC closer to its all-time high of $111,917.
Easing geopolitical tensions, rising bets on a Q3 Fed rate cut, and spot ETF inflows boosted BTC demand.
US Data Reveal Cracks in the Economy
Friday’s US Personal Income and Outlays report supported expectations of a Q3 Fed rate cut. While inflation edged higher, personal income and spending unexpectedly fell in May, suggesting a weaker consumption outlook.
Given private consumption contributes over 60% to the US economy, a pullback in disposable income and consumer spending could raise recession risks. Weaker spending may also dampen demand-driven inflationary pressures. Friday’s data followed a sharper-than-expected economic contraction in Q1 (-0.5% QoQ vs prelim. -0.2%).
According to the CME FedWatch Tool, this week’s data and Fed comments pushed the odds of a Q3 Fed rate cut up from 69.7% (June 20) to 91.4% (June 27). Several Fed speakers, including Susan Collins, Mary Daly, Austan Goolsbee, and Michelle Bowman, signaled support for further monetary policy easing.
Could BTC retest record highs? US BTC-Spot ETF Market Extends Inflow Streak
Market expectations of a Q3 Fed policy move drove demand for US BTC-spot ETFs. According to Farside Investors, inflows skyrocketed. Key inflows for the week ending June 27 included:
- BlackRock’s (BLK) iShares Bitcoin Trust (IBIT) continued to dominate, with weekly net inflows of $1,310.9 million.
- Fidelity Wise Origin Bitcoin Fund (FBTC) had net inflows of $504.5 million.
- ARK 21Shares Bitcoin ETF (ARKB) saw net inflows of $268.2 million.
The US BTC-spot ETF market extended its net inflow streak to 14 sessions, with total weekly net inflows of $2,214.8 million. After a cautious start to the month, total net inflows for June stand at $4,476.6 million, another solid showing after May’s inflows of $5,232.1 million. Spot ETF inflows drove BTC to a record high of $111,917 in May.
BTC Price Outlook: Key Drivers
BTC’s near-term price trajectory hinges on several key macro and market drivers:
- Middle East developments.
- Trade headlines.
- Legislative updates, including Bitcoin Act-related news.
- The upcoming US economic data and Fed cues.
- US BTC-spot ETF flows.
BTC Price Scenarios:
- Bullish Scenario: Easing geopolitical tensions, dovish Fed rhetoric, bipartisan support for crypto bills, upbeat US data, and ETF inflows may drive BTC toward $111,917.
- Bearish Scenario: Renewed geopolitical tensions, hawkish Fed signals, legislative roadblocks, US recession jitters, or ETF outflows could push BTC below $100,000.
For ongoing insights into macro trends, regulation, and ETF data, follow our analysis here.
Technical Analysis
Bitcoin Analysis
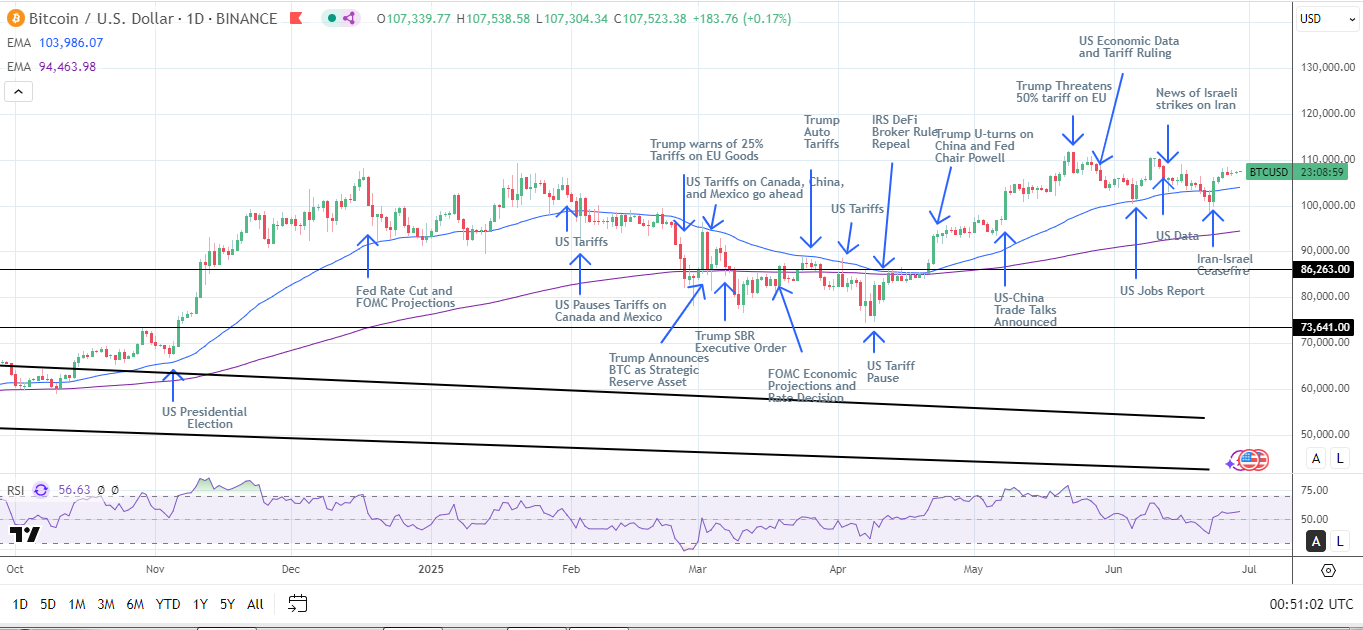
BTC trades above its 50-day and 200-day Exponential Moving Averages (EMA), signaling bullish momentum.
- Upside Target: A breakout above the June 26 high of $108,402 could pave the way to $110,000. A sustained move through $110,000 may support a move through $111,917, bringing $115,000 into sight.
- On the downside, a drop below $105,000 and the 50-day EMA could expose sub-$100,000 levels. Intensifying selling pressure may enable the bears to target the 200-day EMA.
The 14-day Relative Strength Index (RSI) at 56.63 suggests BTC could climb to the record high of $111,917 before entering overbought territory (RSI > 70).
Stay ahead of market trends by accessing real-time BTC price data and technical indicators here.
Ethereum Trails as BTC Dominates Flows
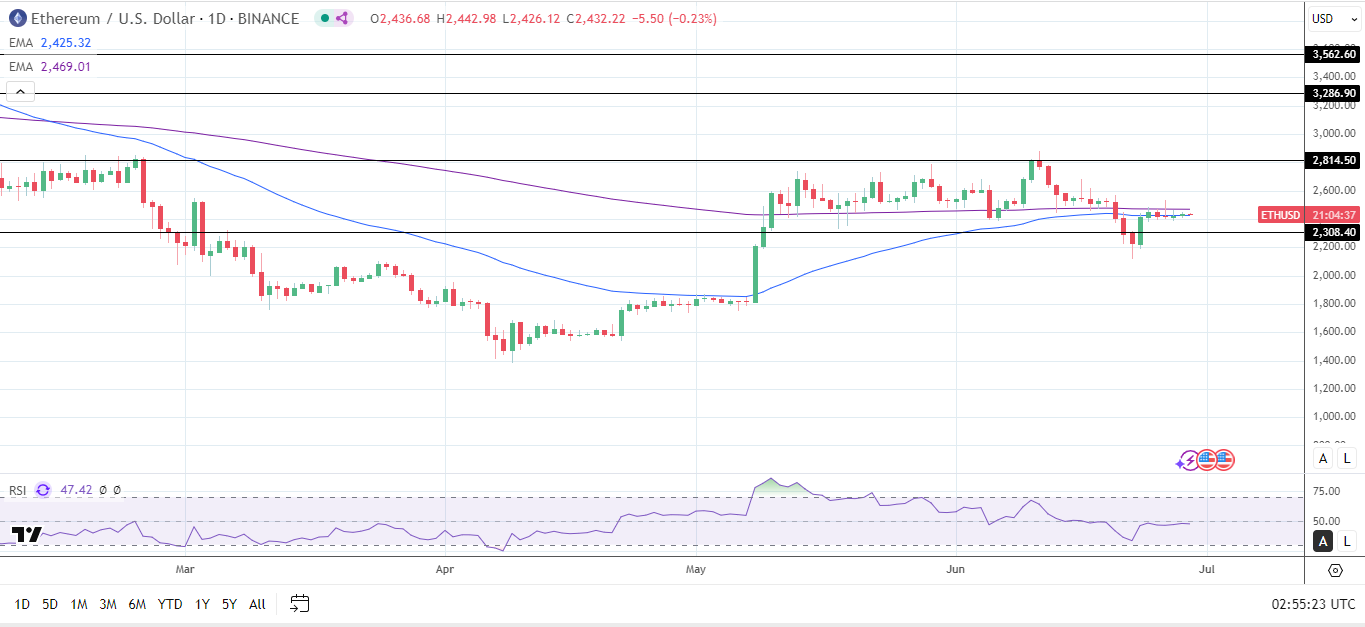
Turning to ethereum (ETH), ETH trades above the 50-day EMA while remaining below the 200-day EMA. The EMAs send bullish near-term but bearish longer-term price signals. While BTC spot ETFs drew $2.2B, ETH funds lagged with sub-$300 million inflows.
- Upside target: A breakout above the 200-day EMA would support a move toward the June high of $2,879. A move through $2,879 could open the door to retesting the $2,815 resistance level.
- On the downside, a drop below the 50-day EMA would bring the $2,308 support level into play. If ETH falls below $2,308, the bears could target the June low of $2,119, with $2,000 being the next key psychological support level.
The 14-day Relative Strength Index (RSI) at 47.42 indicates ETH could drop to the June low of $2,119 before entering oversold territory (RSI< 30).
Stay informed on BTC and ETH trends by tracking macroeconomic developments, ETF flows, and technical indicators here.
About the Author
Bob MasonChief Crypto Boss
123456789 30 He has written extensively for a broader audience and his current focus is on developments relating to the financial markets including, but not limited to currencies, commodities, alternative asset classes, and global equities.


Advertisement