
Advertisement
Advertisement
Oil and Natural Gas Technical Analysis: Oil Drops After Trump Announces Iran-Israel Ceasefire
By:
Key Points:
- WTI Crude Oil (CL) shows strong volatility following the US strikes on Iran.
- Natural Gas (NG) remains in an uptrend above the $3.00 level.
- US Dollar Index (DXY) continues its downward trend from the 50-day SMA.

Oil prices dropped sharply after Iran targeted a US military base in Qatar but avoided disrupting oil shipping. Brent and WTI crude oil (CL) fell more than 7%, marking the steepest one-day loss since 2022. The limited retaliation helped calm fears of an immediate supply disruption through the Strait of Hormuz.
Traders had initially priced in supply risks, pushing prices higher on Monday. However, Iran’s decision to spare shipping routes eased tensions. Markets interpreted the attack as a controlled escalation rather than a broader conflict.
The ceasefire announcement from President Trump triggered a further decline in the price of crude oil. The risk premium on oil has faded for now, but uncertainty remains if either side breaks the agreement. Oil prices show strong volatility during the Iran-Israel conflict and await further news on geopolitical developments.
WTI Crude Oil (CL) Technical Analysis
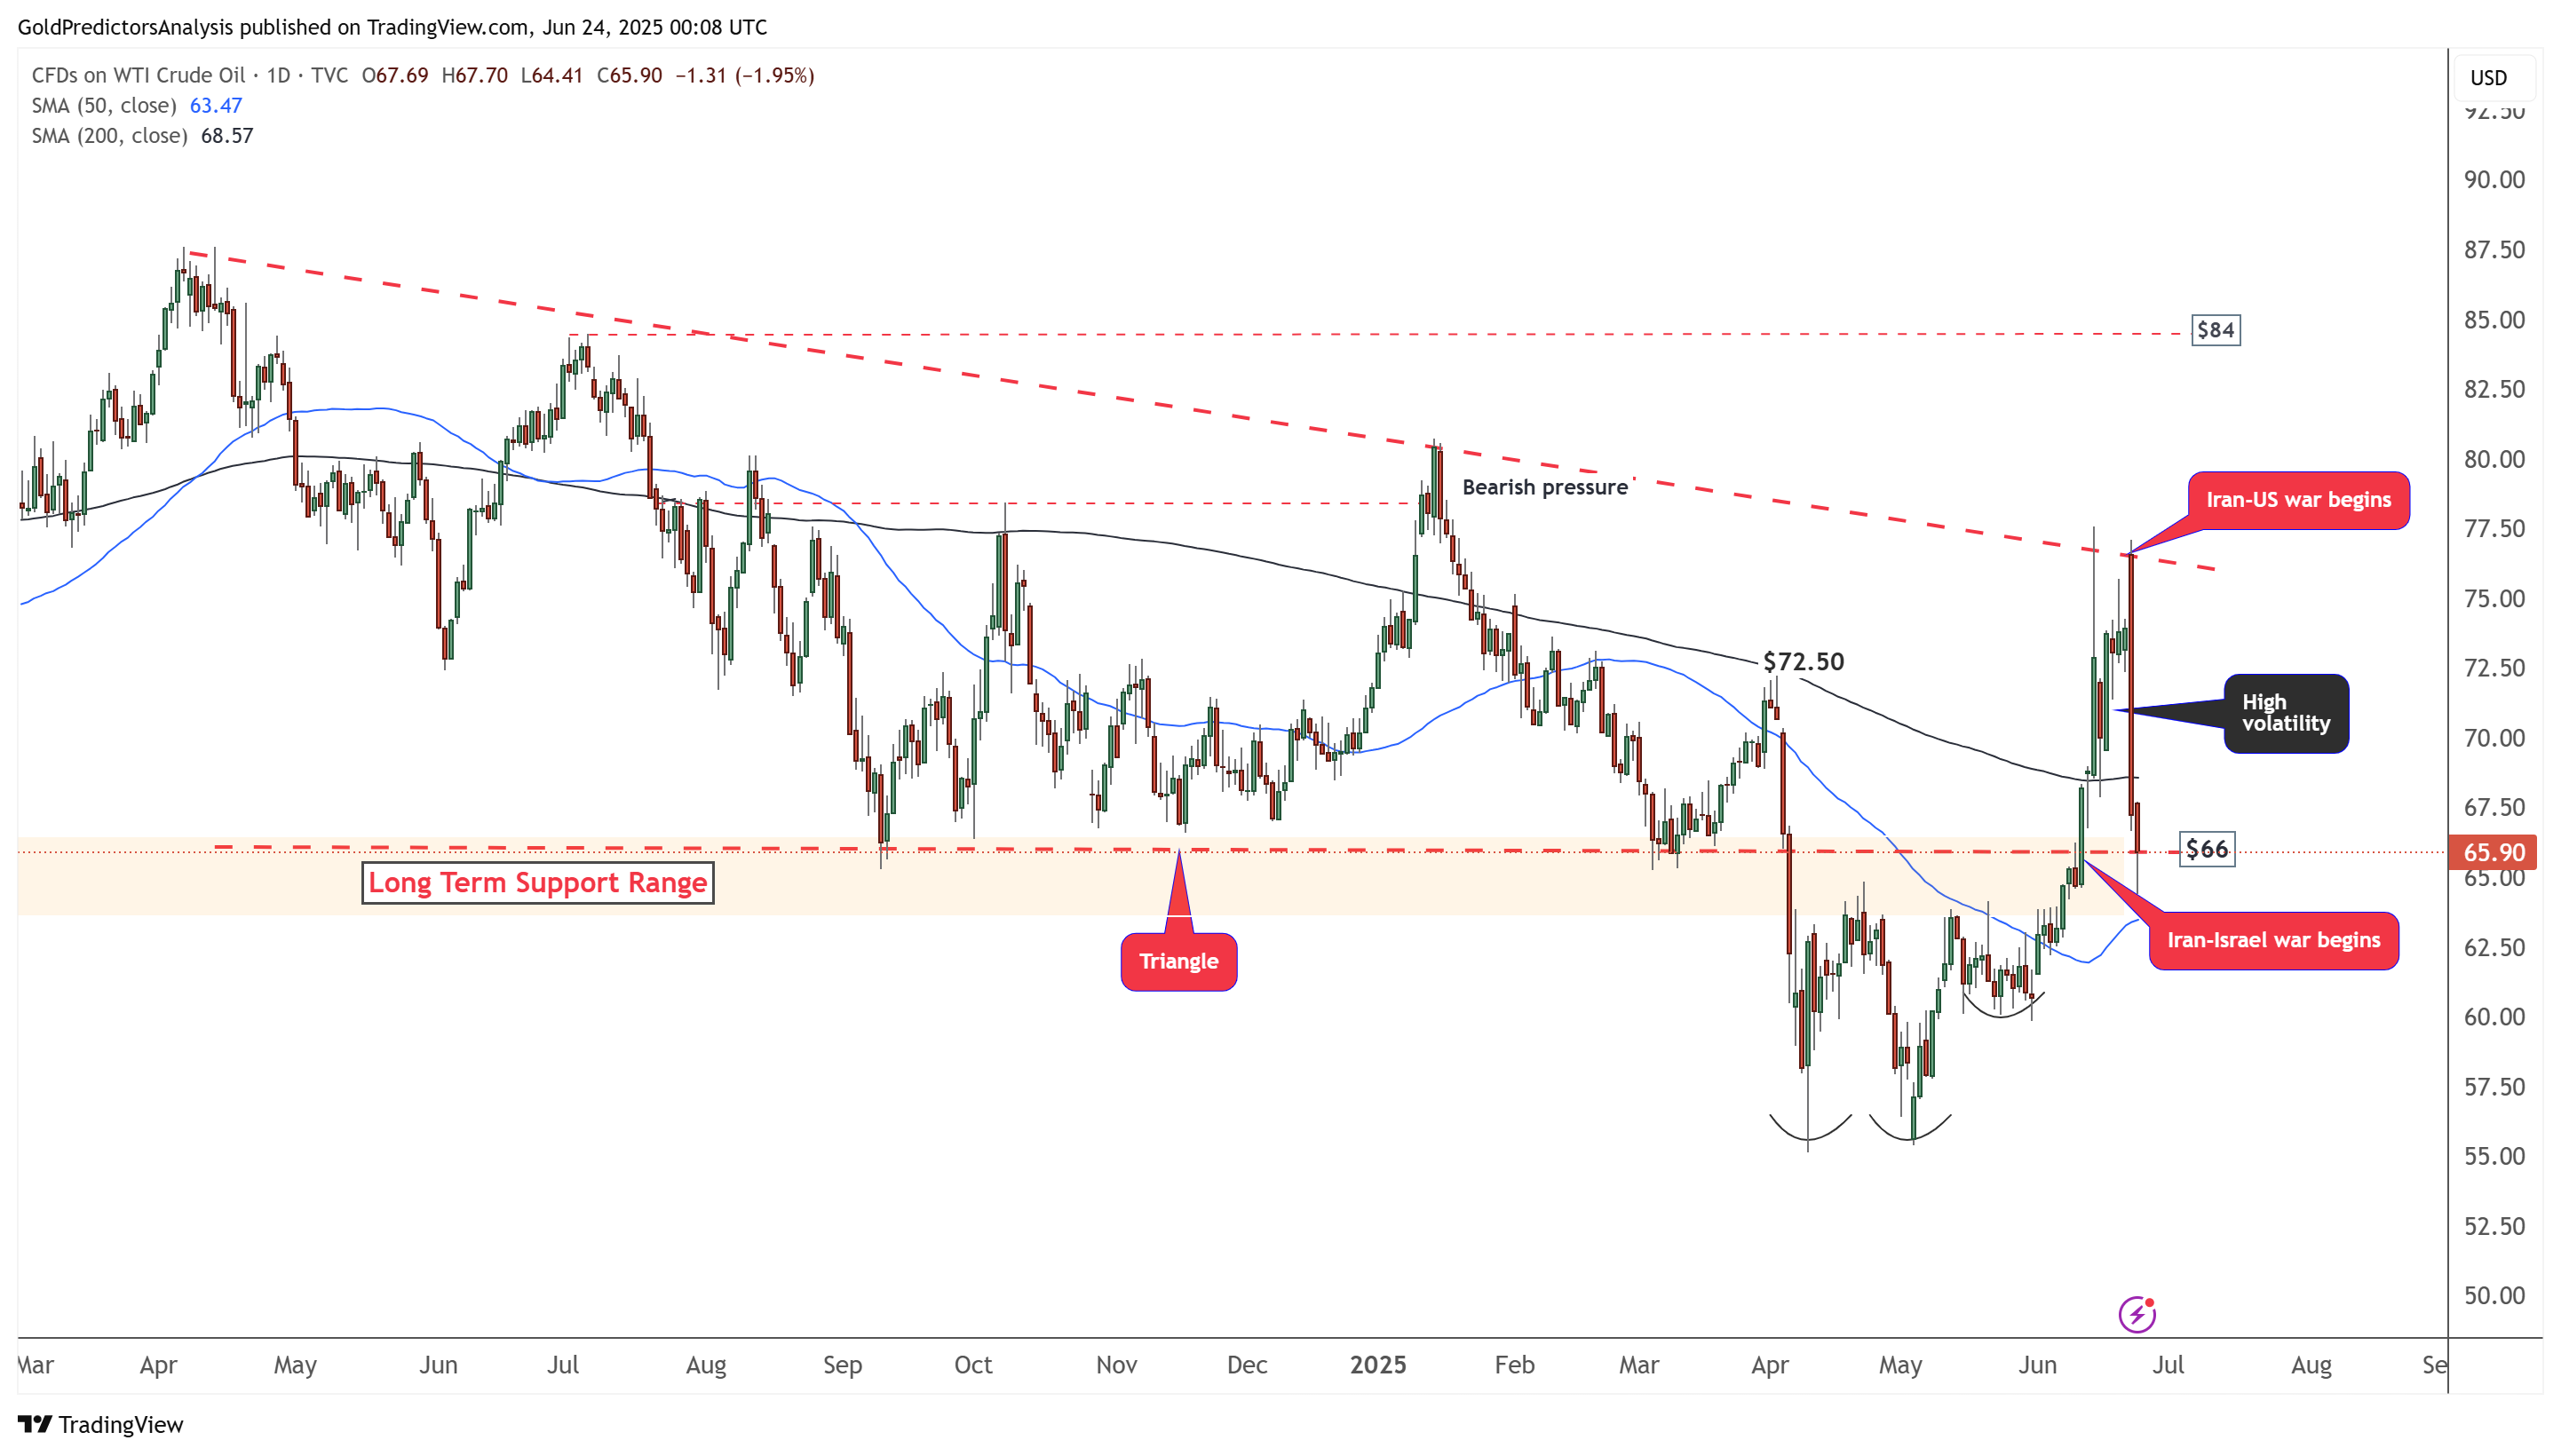
WTI Oil Daily Chart – Strong Volatility
The daily chart for WTI crude oil shows that the price hit resistance at the red dotted trendline near the $77 area. After reaching this level, the price dropped toward the $65 support level. A break above $77 may lead to a move toward the $84 area, and a sustained move above $84 could initiate a long-term rally in oil prices. However, oil prices exhibit intense volatility in the $65 to $77 range.
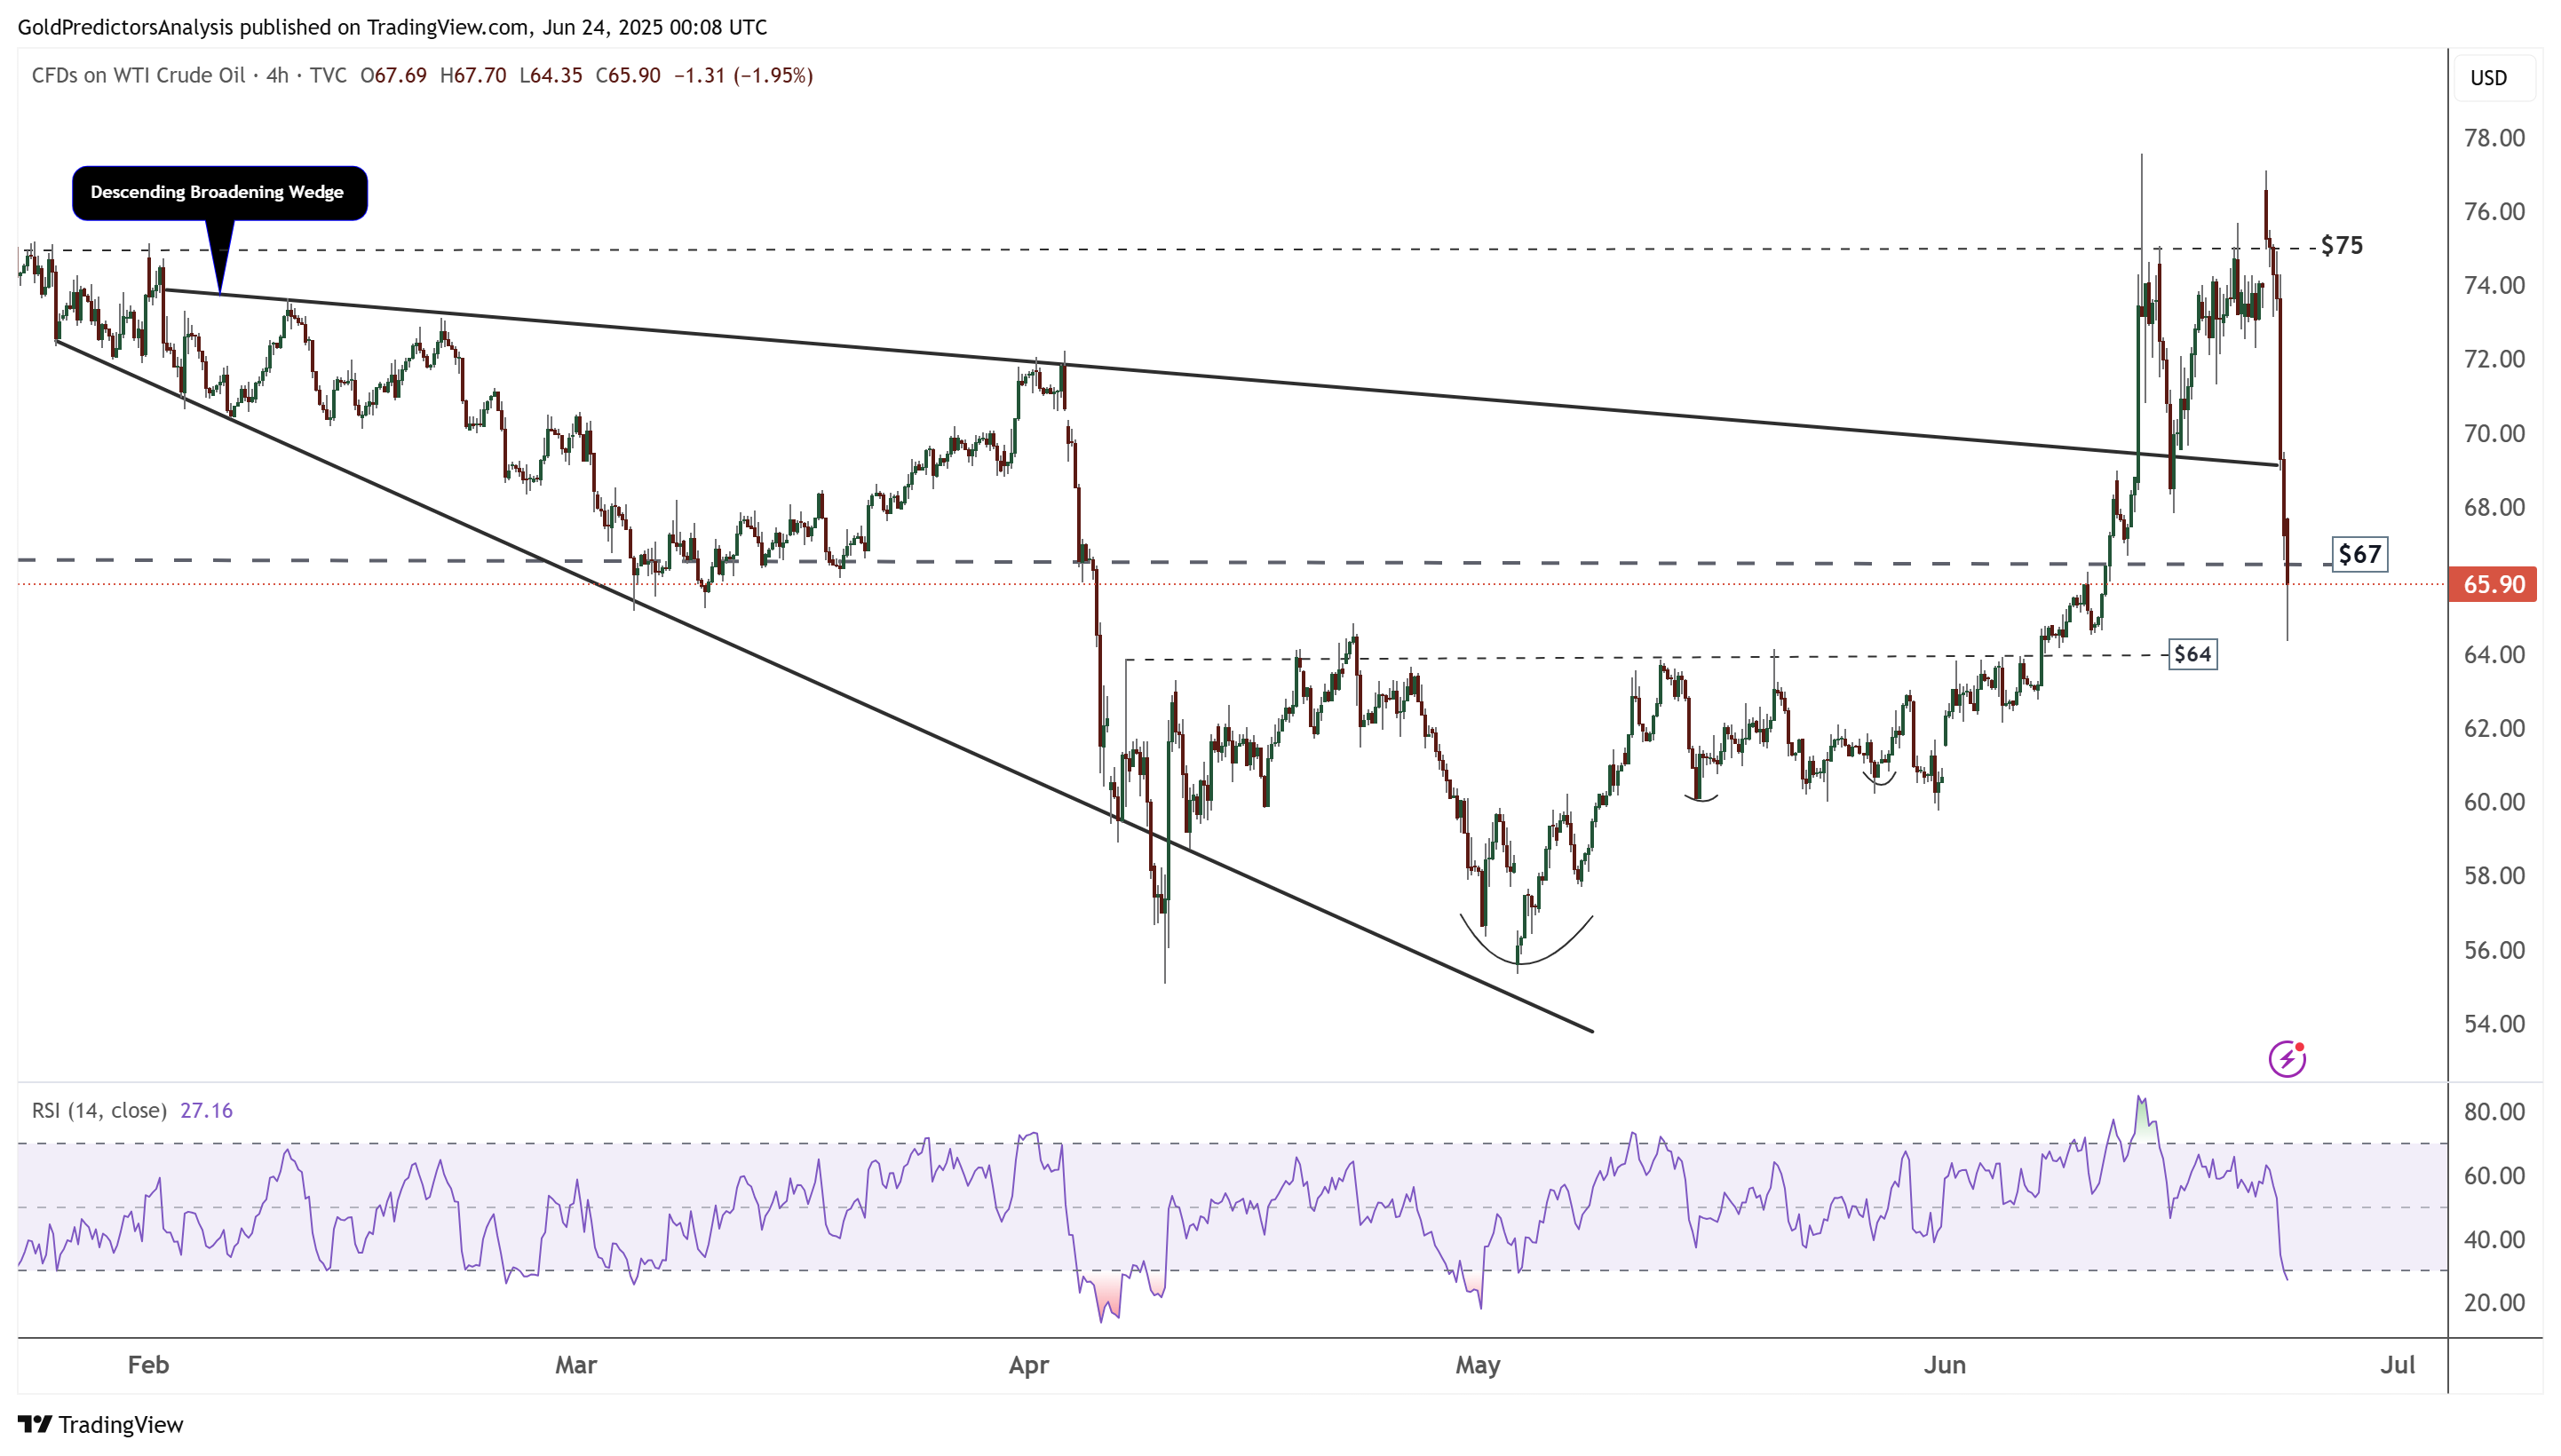
WTI Oil 4-Hour Chart – Descending Broadening Wedge
The strong resistance in WTI crude oil around the $77 area is also confirmed by the target of the descending broadening wedge pattern that has been forming since February 2025. A break above $77 could trigger a strong upward move; however, immediate support lies near the $65 area.
Natural Gas (NG) Technical Analysis
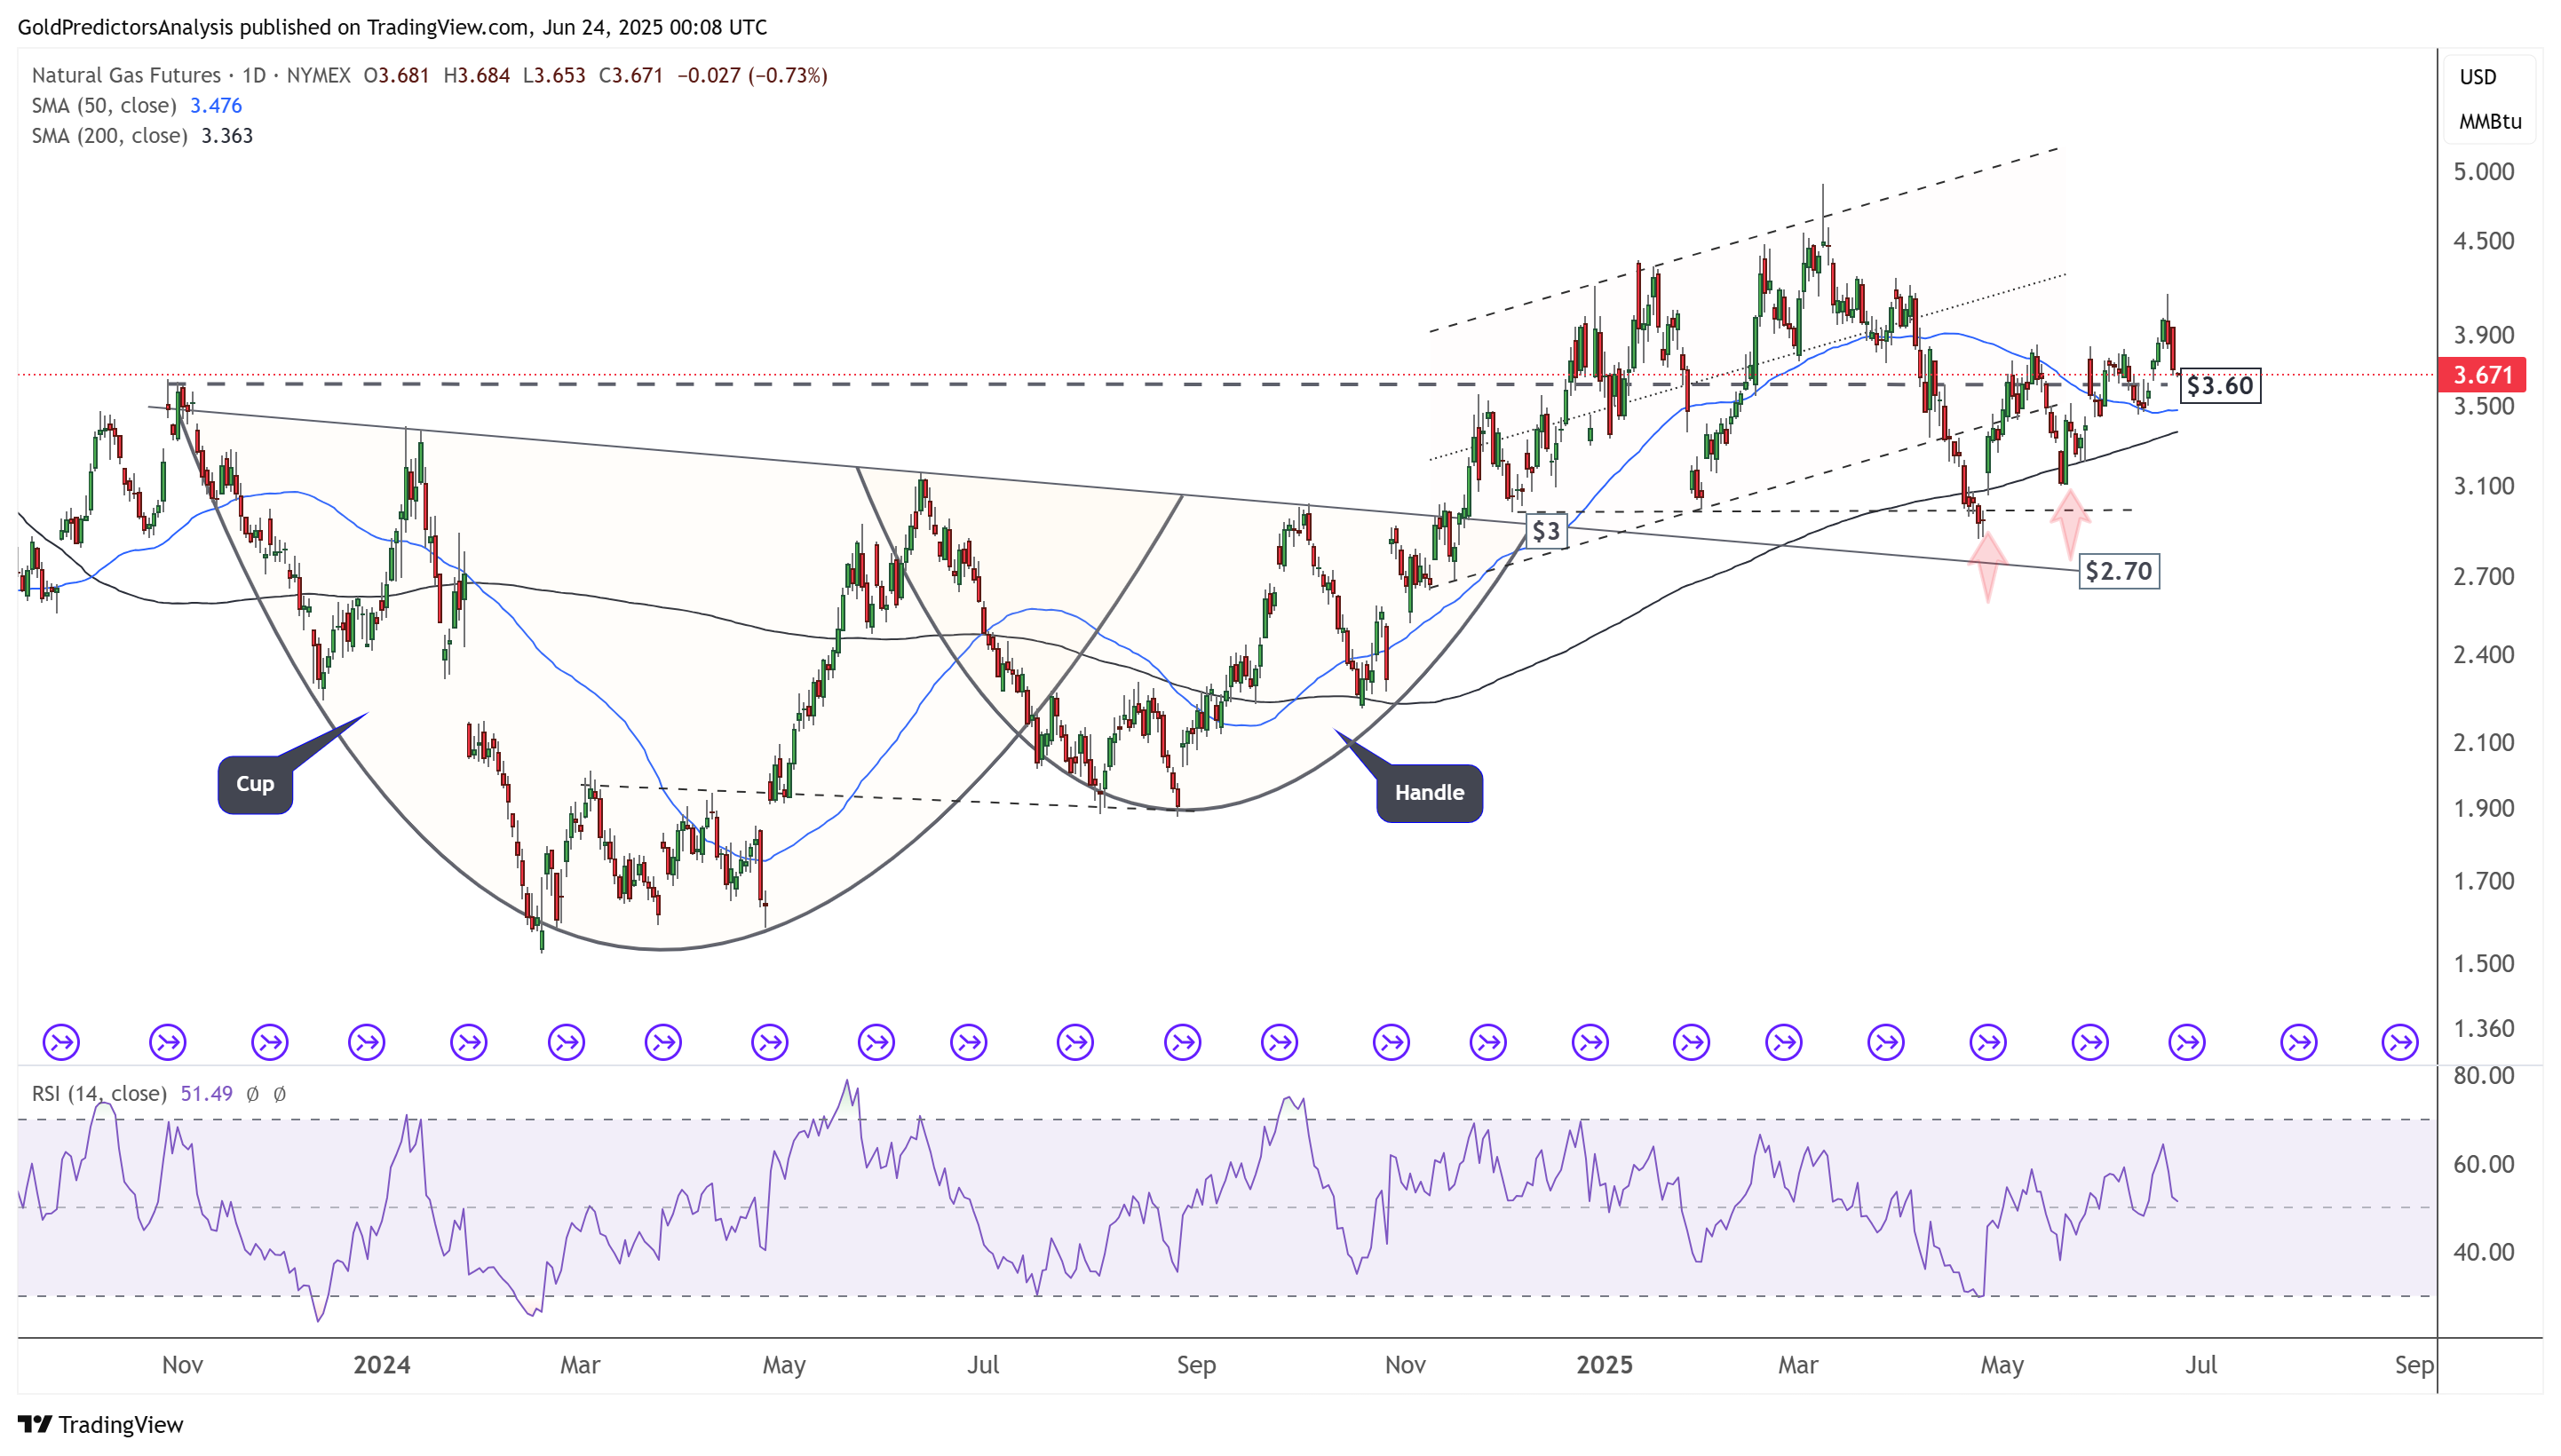
Natural Gas Daily Chart – Key Level of $3
The daily chart for natural gas (NG) exhibits strong volatility above the $ 3.00 area. Despite this, the price remains above the 50-day and 200-day SMAs, indicating a positive trend. The formation of a cup and handle pattern, followed by consolidation within an ascending channel, signals strong price momentum. A break above the $4 level could trigger a move toward the $5 area in natural gas.
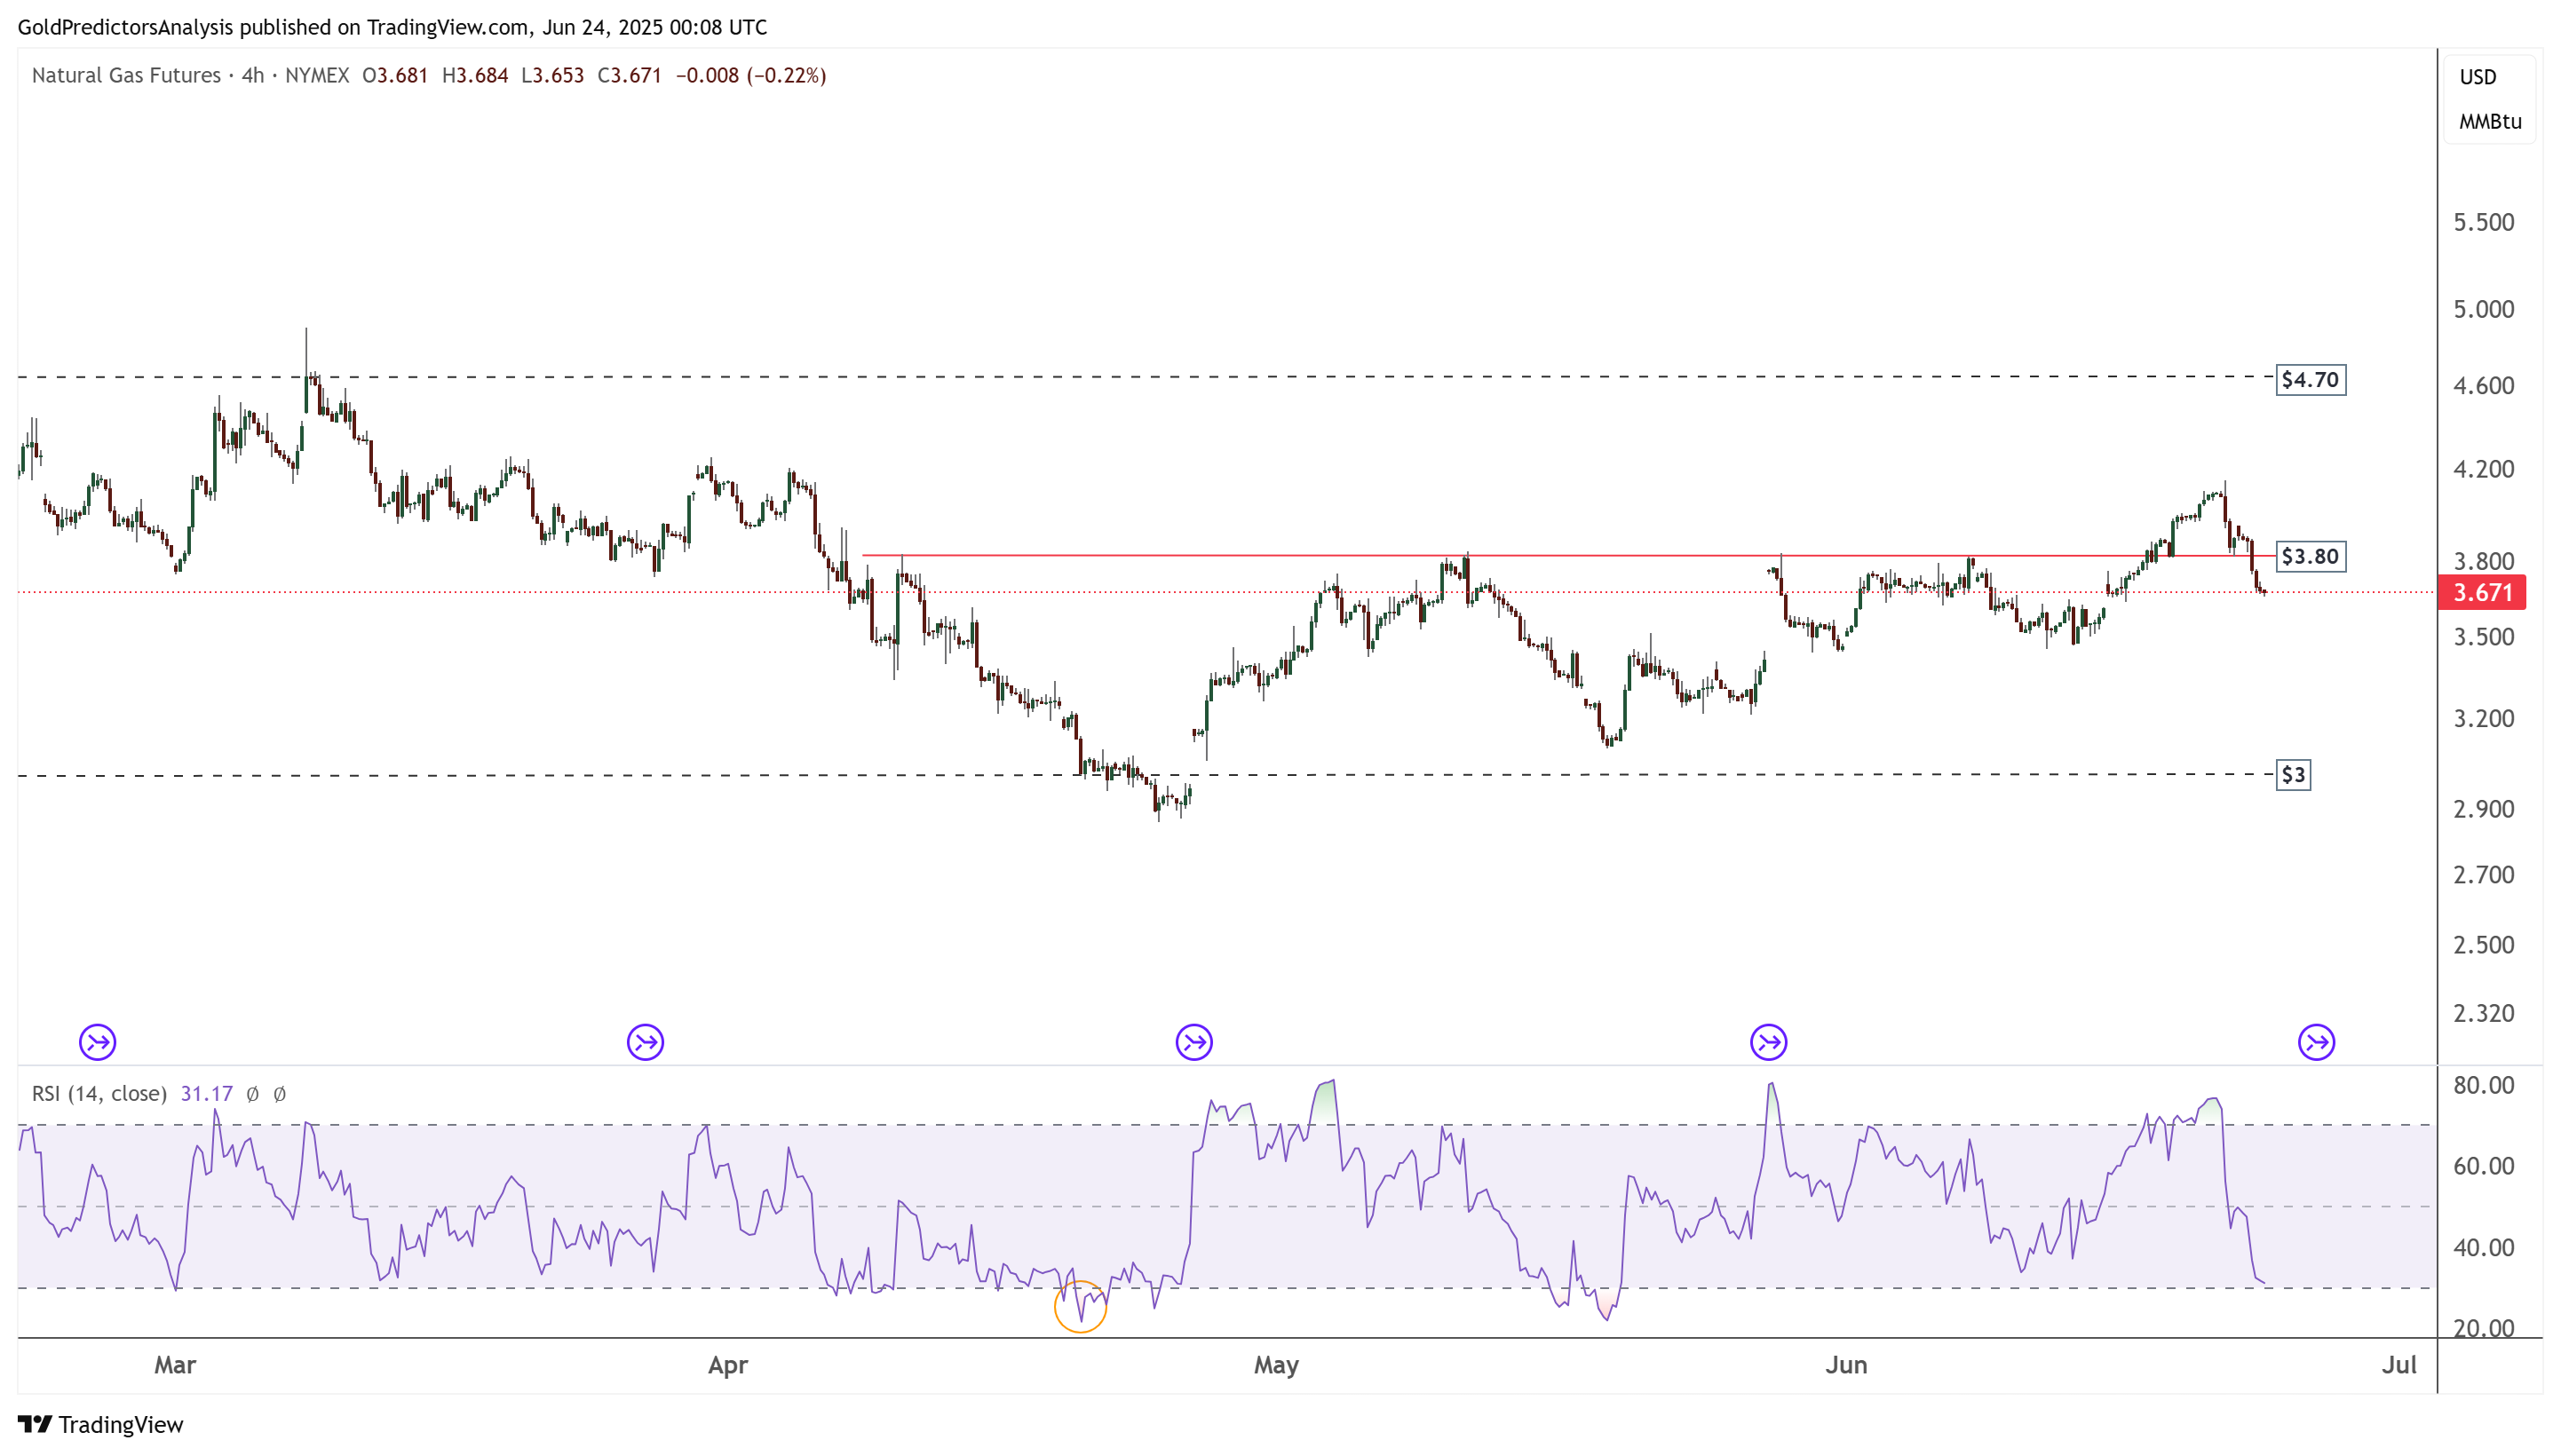
Natural Gas 4-Hour Chart – Consolidation
The 4-hour chart for natural gas shows that the price is consolidating between the $3.00 and $4.70 levels. A break above $4.70 could trigger a move toward higher prices, while a break below $3.00 would suggest further downside in natural gas.
US Dollar (DXY) Technical Analysis
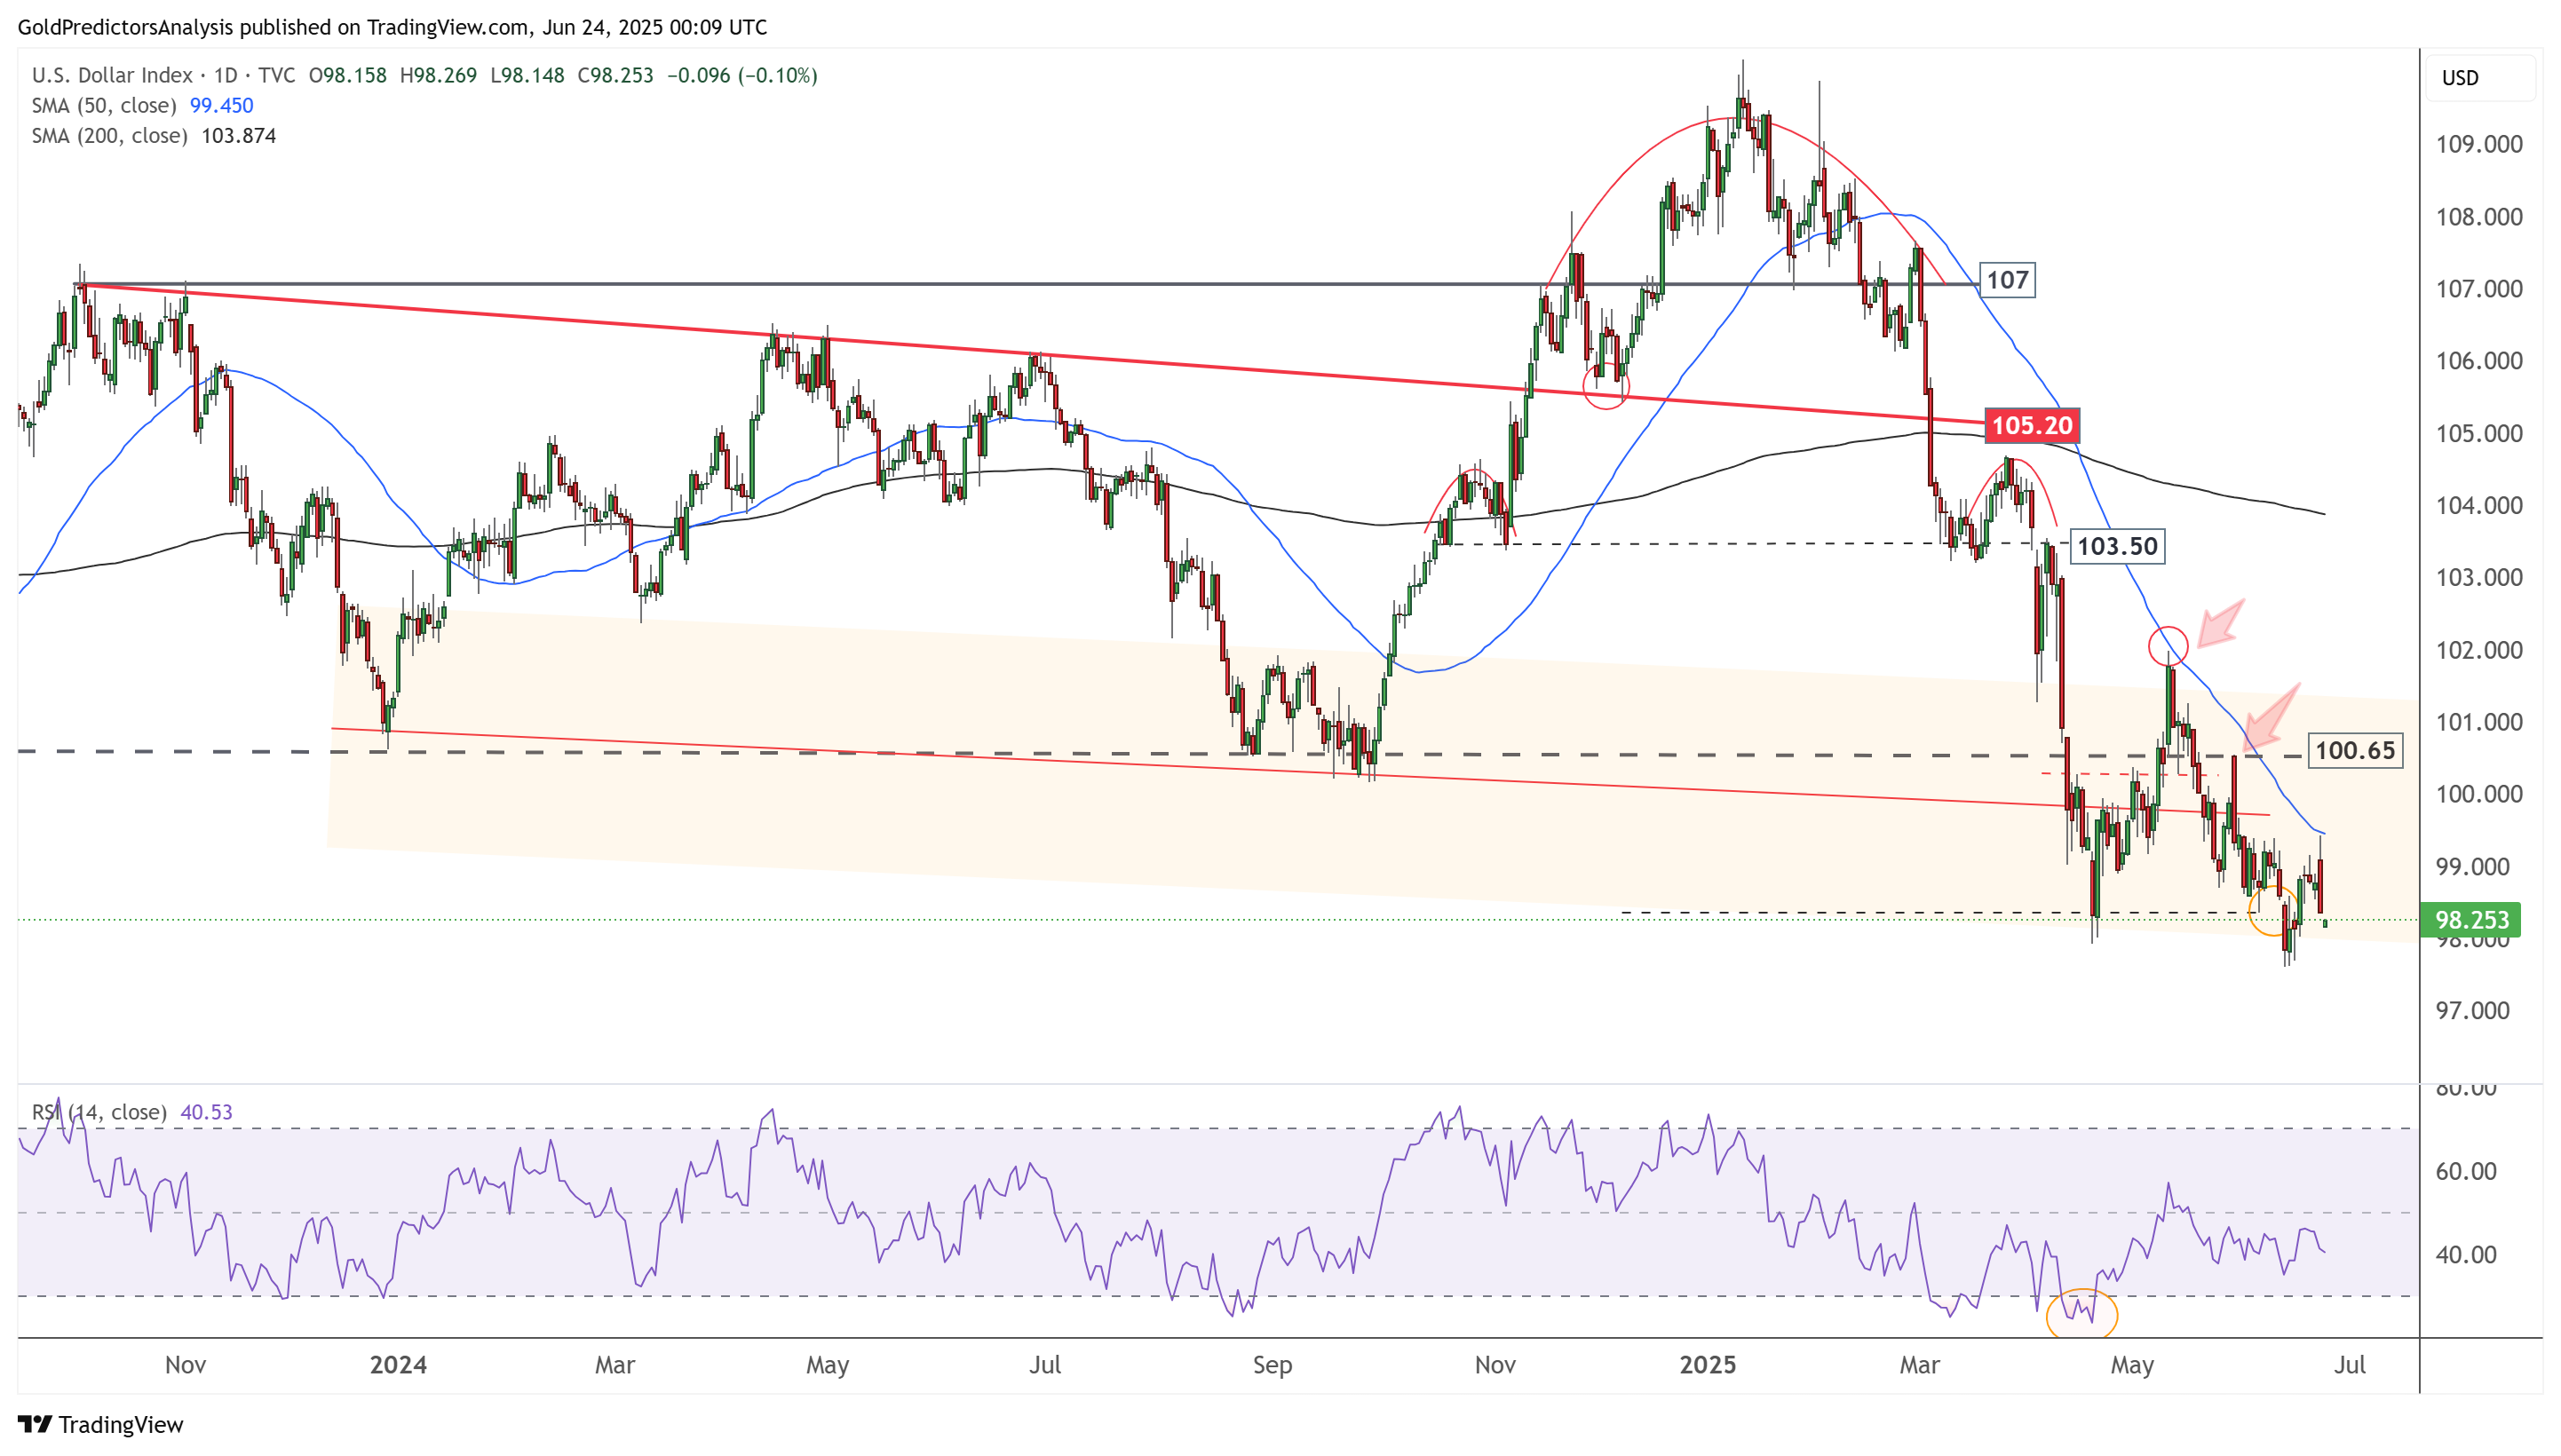
US Dollar Daily Chart – Bearish Pressure
The daily chart for the US Dollar Index shows that it has reached the 50-day SMA and remains under pressure. A break below 98 could trigger a sharp decline toward the 90 area. Additionally, the RSI is consolidating below the 50 level, indicating a bearish trend.
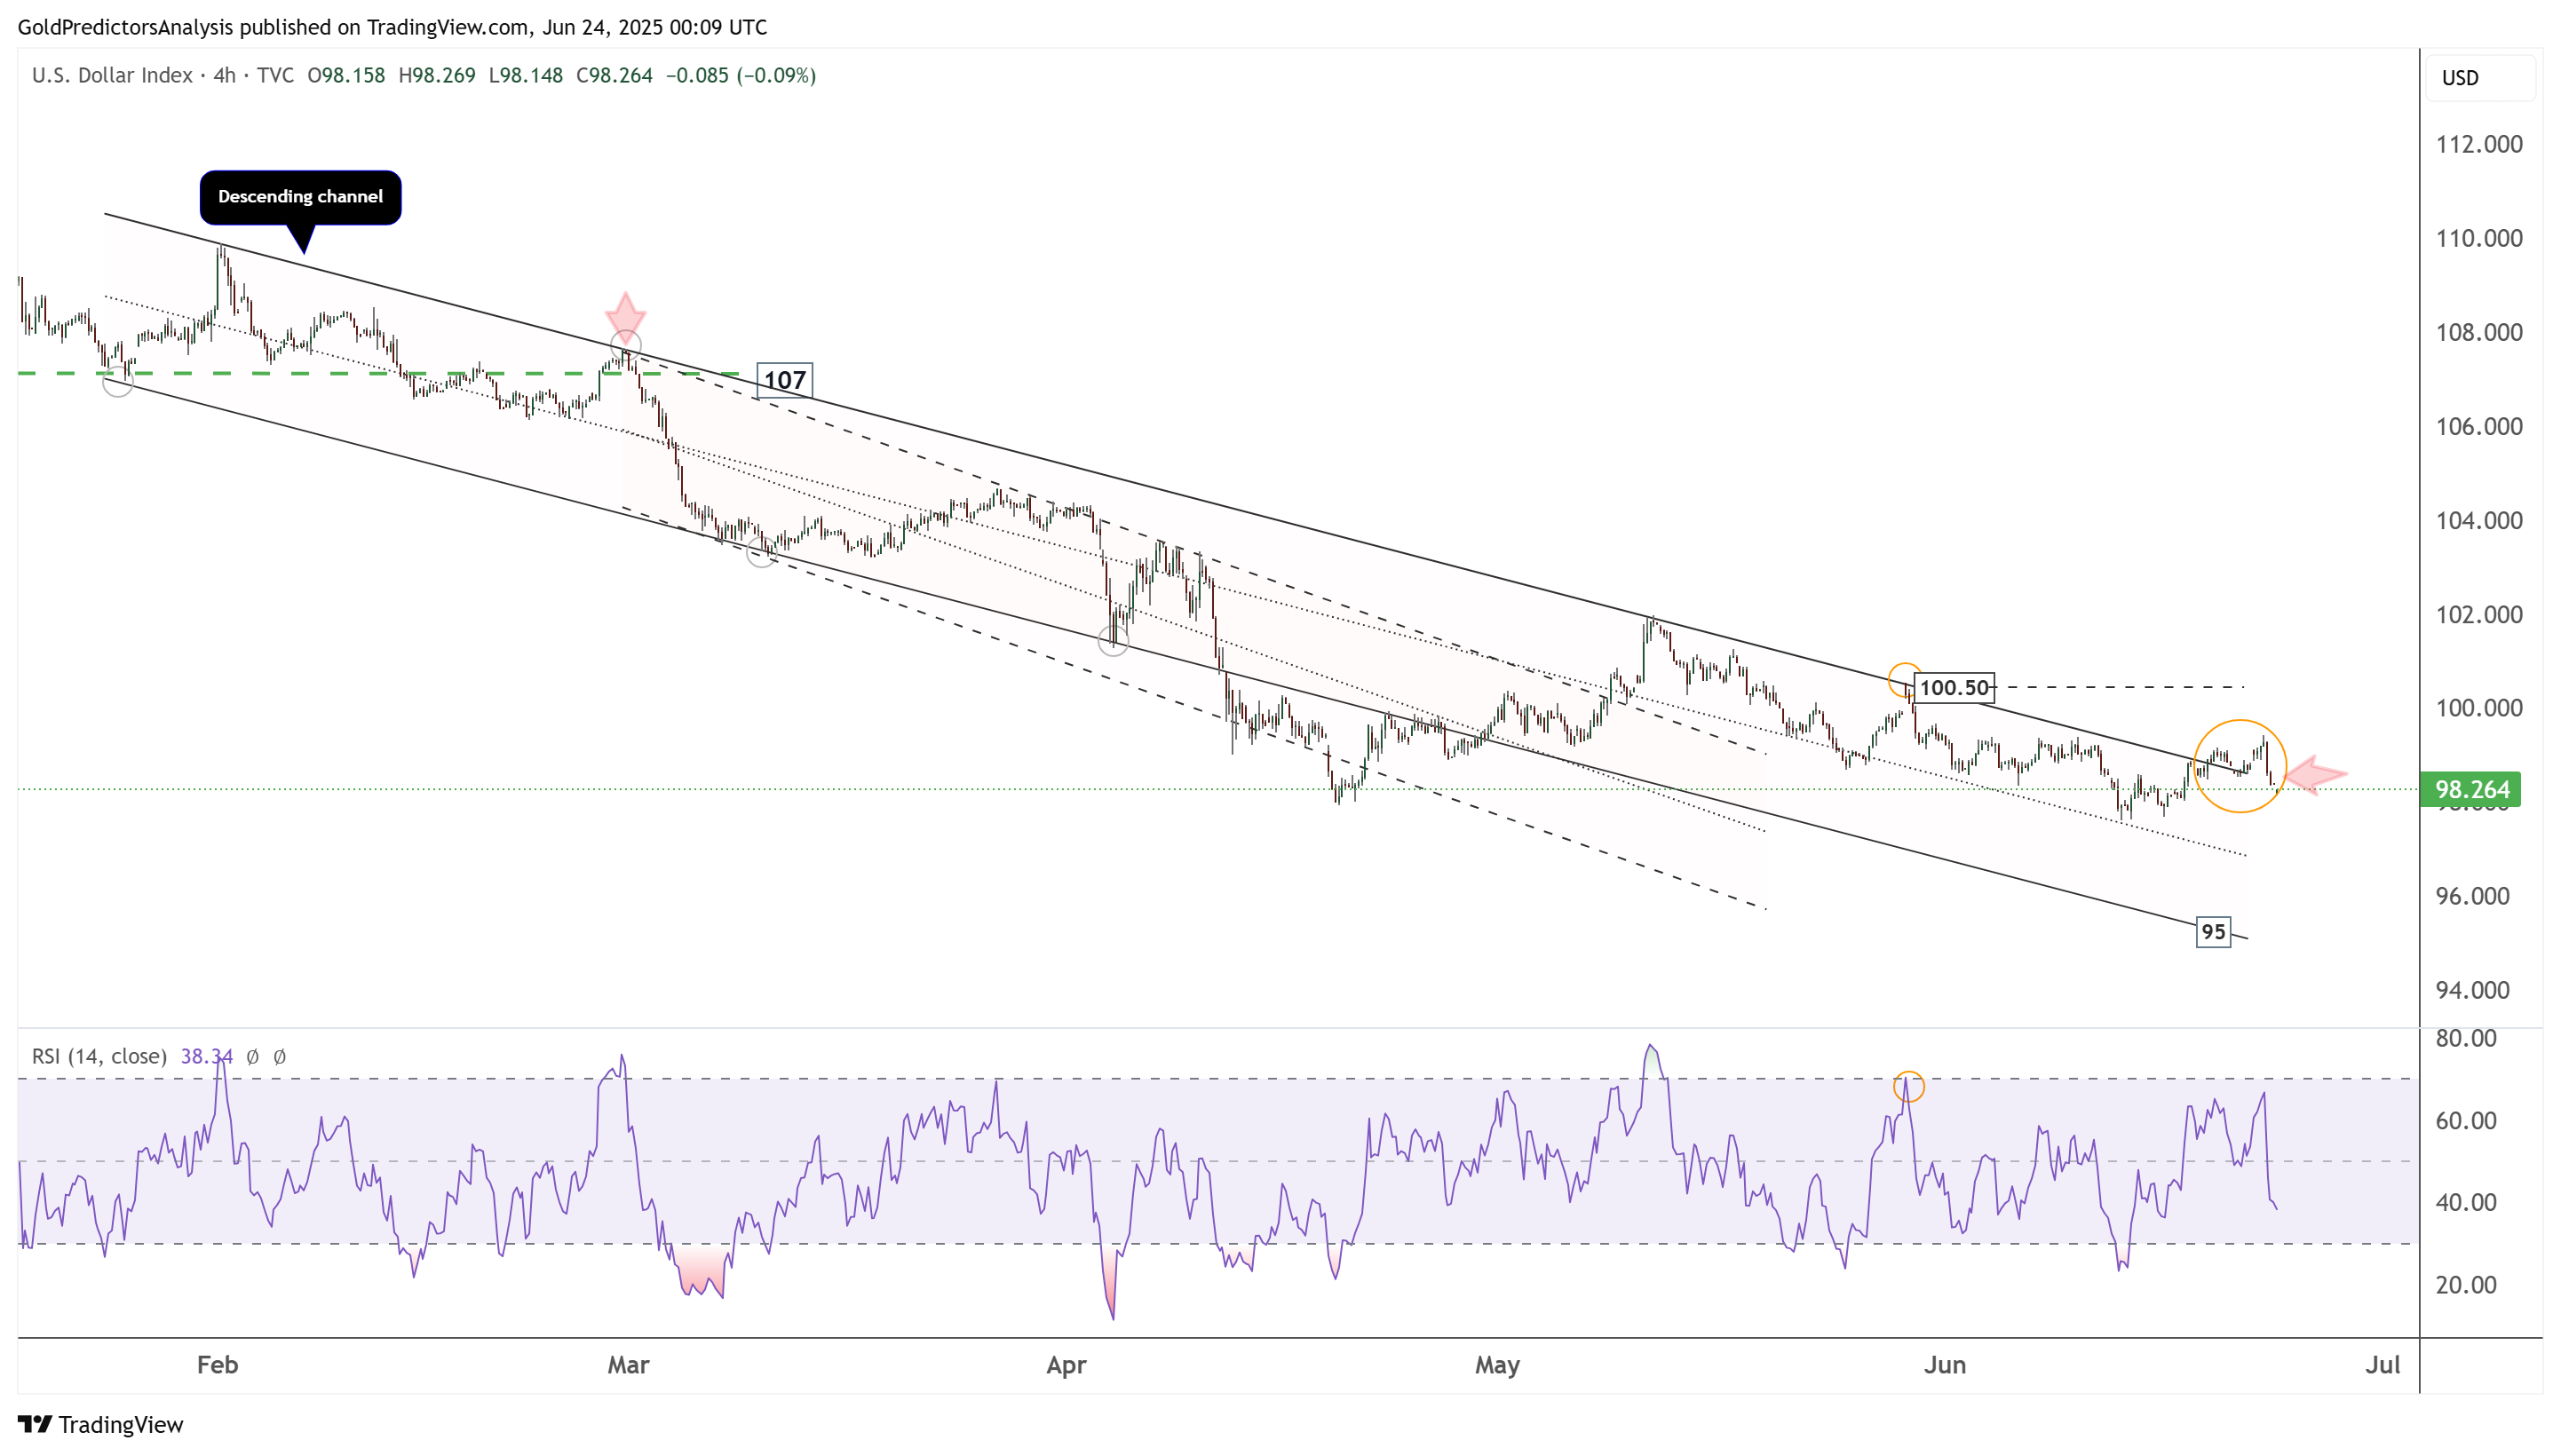
US Dollar 4-Hour Chart – Descending Channel
The 4-hour chart for the US Dollar Index shows that it is trading within a descending channel. An attempt to break above the 99 area failed, and the index continues to move downward within the channel. A break below the 96 area could trigger a decline toward 95, the projected target of the descending channel.
About the Author
Bob MasonChief Crypto Boss
123456789 30 He has written extensively for a broader audience and his current focus is on developments relating to the financial markets including, but not limited to currencies, commodities, alternative asset classes, and global equities.


Advertisement