
Advertisement
Advertisement
Natural Gas Price Forecast: Gas Tests Key Support Amid Bullish Trend Structure
By:
Despite a sharp pullback, natural gas remains in a bullish structure supported by trendlines, Fibonacci levels, and the significant 200-Day moving average.
Natural gas fell sharply lower on Monday, reaching a low of $3.42 for the day after triggering a drop below Friday’s low of $3.51. This established a lower daily low and lower high and provided another test of dynamic support for the immediate uptrend, begun from the April swing low.
Support was seen at an uptrend line newly generated following last week’s new higher swing low. This is bullish behavior but only if support is retained. A successful test of support at the 200-Day MA will also have been completed today if natural gas continues to stay above the 200-Day line, currently at $3.39.
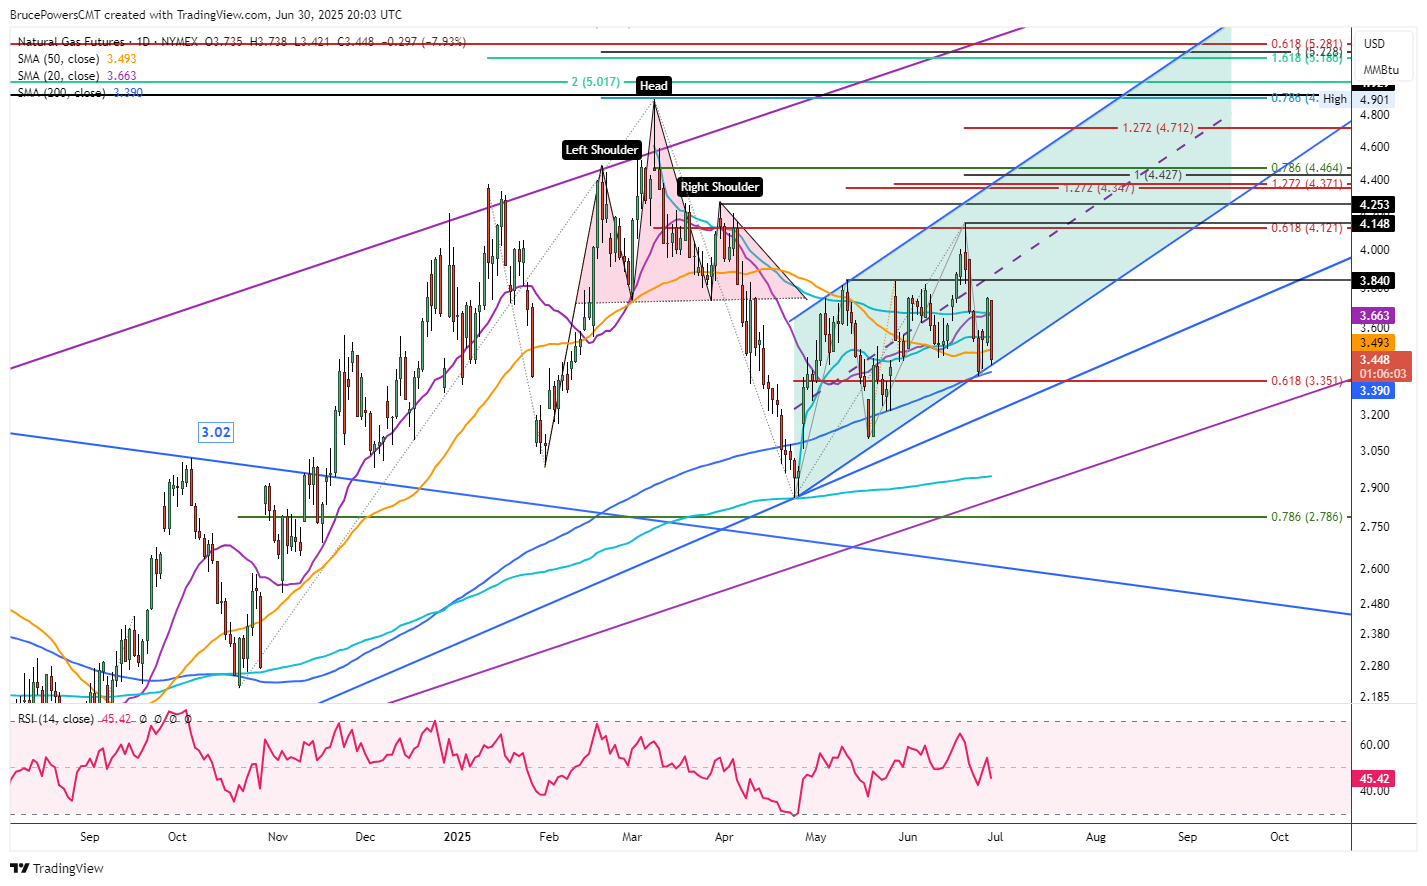
Key Support at Last Week’s Low of $3.37
Last week’s higher swing low at $3.37 is more significant support as it is now part of the near-term bullish trend structure of higher swing lows. A bullish reversal following today’s low will be needed to further confirm trendline support. Support last week was seen at the confluence of the 61.8% Fibonacci retracement and the 200-Day MA. It was followed by a sharp one-day bullish reversal last Friday, which ended near the highs of the day.
The sharp bearish reversal seen today might be part of a shakeout before natural gas continues higher or the early signs of additional selling pressure that could lead to a break below the 200-Day MA and last week’s low. However, until then, the expectation is for the bullish trend to continue. It is contained within a long-term bull trend that began from the February 2024 lows.
Short-term Consolidation
On the daily chart, strength is not indicated until there is a rally above Friday’s high of $3.75. Therefore, given the relatively large price range for today, natural gas could trade within the range for a few days while it further test areas of dynamic support. Given its long-term nature and widespread use, the 200-Day is clearly showing support and needs to be respected unless signs of failure appear.
Finally, be aware that the swing low from last week is also a weekly low. Therefore, it takes on additional significance if it fails to hold. Moreover, that increases the chance for support to hold above that low as last week ended in a relatively strong position, in the top half of the week’s trading range.
For a look at all of today’s economic events, check out our economic calendar.
About the Author
Bruce Powerscontributor
Bruce has been involved in the financial markets for over 20 years, as an analyst, trader, educator, and writer.


Advertisement