
Advertisement
Advertisement
Crypto Price News: BTC & ETH Take a Hit – Key Levels to Watch
By:
Key Points:
- Rising tensions in the Middle East have spooked investors.
- BTC just broke below $107,000 and should be heading to the low $100,000s.
- ETH is still in consolidation mode but the price just broke below a key EMA.

The armed conflict between Israel and Iran is threatening to destabilize the region, which could lead to an unwanted escalation that gets other more influential actors involved.
The oil markets have been shocked and so have the crypto market as these geopolitical tensions tend to trigger a risk-off move across the entire financial system.
Little downward moves nowadays across the crypto space tend to trigger big sell-offs as the lower time frames seem to show as the market was too leveraged ahead of this event due to Bitcoin’s push to a new all-time high.
Retail investors may have expected that certain altcoins like XRP (XRP) and Ethereum will follow through with Bitcoin and retest their all-time highs but that hasn’t been the case at all.
Meanwhile, the market’s consensus opinion for Wednesday’s upcoming is that the Fed will not make any changes to interest rates. That should subtract a bit of volatility but Chairman Jerome Powell’s comments will still be thoroughly scrutinized.
Bitcoin Could Drop to $90,000
Looking at Bitcoin’s 4-hour chart we can clearly see the key levels that have played a key role in shaping the token’s latest price action.
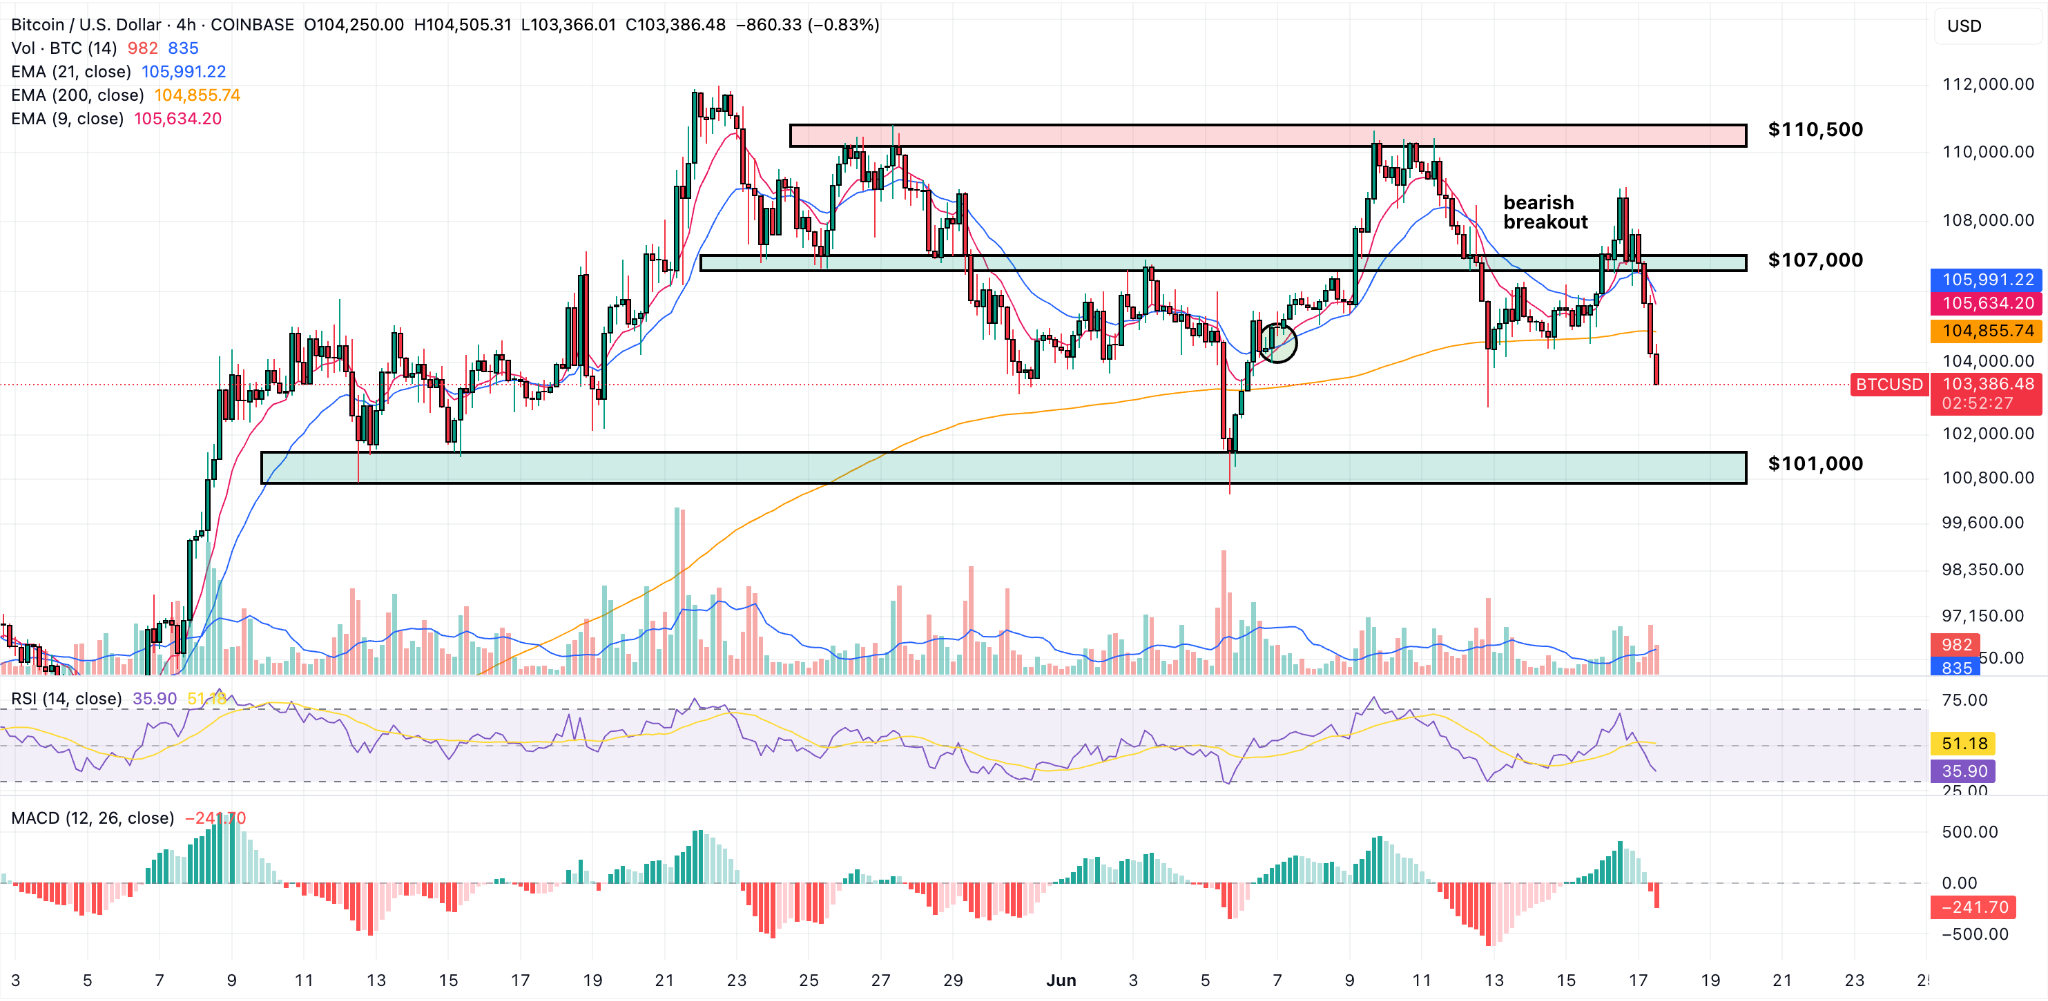
We shared these levels in a recent price prediction and emphasized that the $110,500 had acted as a key resistance multiple times and this could result in a drop toward $107,000 in the near term.
That was exactly what happened just a few hours later. We had a first bearish breakout, a failed retest (bull trap), and now the price is heading toward $101,000 which is another key support to watch we highlighted back then.
Notably, BTC has dropped below the 200-period exponential moving average (EMA) in this lower time. This favors a bearish outlook and increases the odds of a bearish breakout below this key support area. If that happens, BTC could be heading toward the low 90,000s.
ETH Drops Below Key EMA and Risks Losing Its $2,400 Support
Ethereum’s price action is quite different from Bitcoin as the token has been in consolidation for more than a month after a strong rally pushed it above the $2,400 level.
Now this has become the key support to watch for the top altcoin and traders who identified this consolidation throughout this period probably cashed in big.
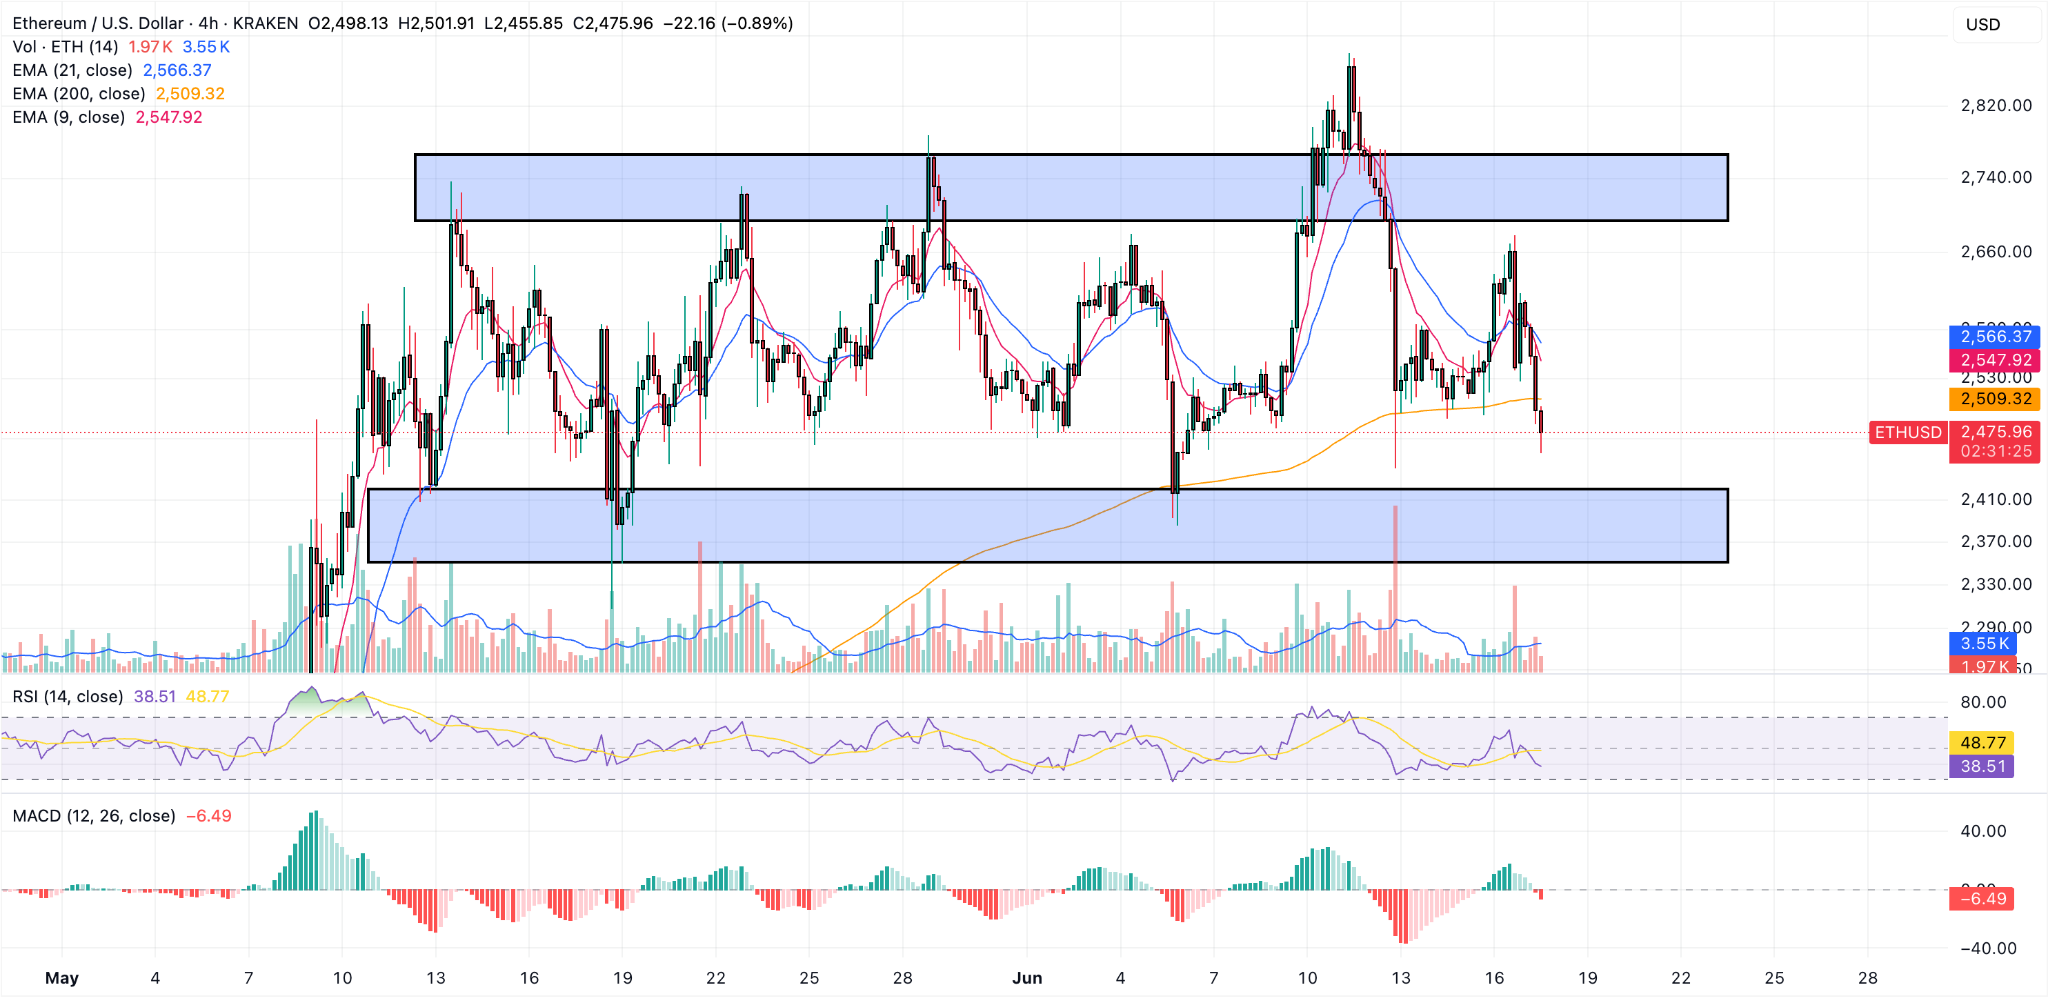
Now, the price seems headed to retest the lower end of this rectangle at $2,400. The question would be, is the selling pressure strong enough to break it?
The price has broken below the 200-period EMA for the first time in more than a month and that could be the ‘sell’ signal that bears needed to push ETH below this marker.
Momentum indicators favor a bearish outlook as well. The Relative Strength Index (RSI) sits at 38. This indicates that the trend is strong.
The $2,300 level could act as support in the near term but theoretically, ETH should retest the $1,800 area if this bearish breakout unfolds.
About the Author
Bob MasonChief Crypto Boss
123456789 30 He has written extensively for a broader audience and his current focus is on developments relating to the financial markets including, but not limited to currencies, commodities, alternative asset classes, and global equities.


Advertisement