
Advertisement
Advertisement
U.S. Dollar Loses Ground Amid Trump Budget Vote and Yield Slide—Analysis for EUR/USD, GBP/USD
By:
Key Points:
- U.S. Dollar Index slips to $99.62 as Treasury yields ease and fiscal uncertainty drives investor caution.
- Moody’s downgrades U.S. credit rating to Aa1, citing debt-to-GDP to rise from 98% (2023) to 134% by 2035.
- Trump-backed budget plan passes House, adding $3.8B to deficit with tax breaks on tips and car loans.

Market Overview
The U.S. Dollar Index (DXY) pulled back to around $99.62 during early Asian trading session, reflecting a modest decline in momentum. The move coincided with a softening in U.S. Treasury yields—particularly the 30-year yield, which slipped to 5.03% after peaking at 5.15%, its highest since November 2023.
The pullback underscores heightened caution as investors weigh the implications of a deteriorating U.S. fiscal outlook.
Moody’s Downgrade Deepens Dollar Pressure
Moody’s Investors Service downgraded the U.S. credit rating from Aaa to Aa1, citing an unsustainable fiscal path. It expects federal debt to rise to 134% of GDP by 2035, compared to 98% in 2023.
The projected budget deficit is nearing 9% of GDP, driven by rising interest costs, entitlement spending, and weaker tax revenues.
Trump Budget Vote Fuels Deficit Concerns
The House narrowly passed former President Trump’s budget plan, which the CBO estimates will add $3.8 billion to the deficit. Provisions include tax breaks for tipped workers and car loans, raising questions about long-term debt sustainability.
Fed Governor Christopher Waller noted that steady tariffs could support growth into late 2024, leaving room for possible rate cuts—a comment that further pressured the dollar.
US Dollar Index (DXY) – Technical Analysis
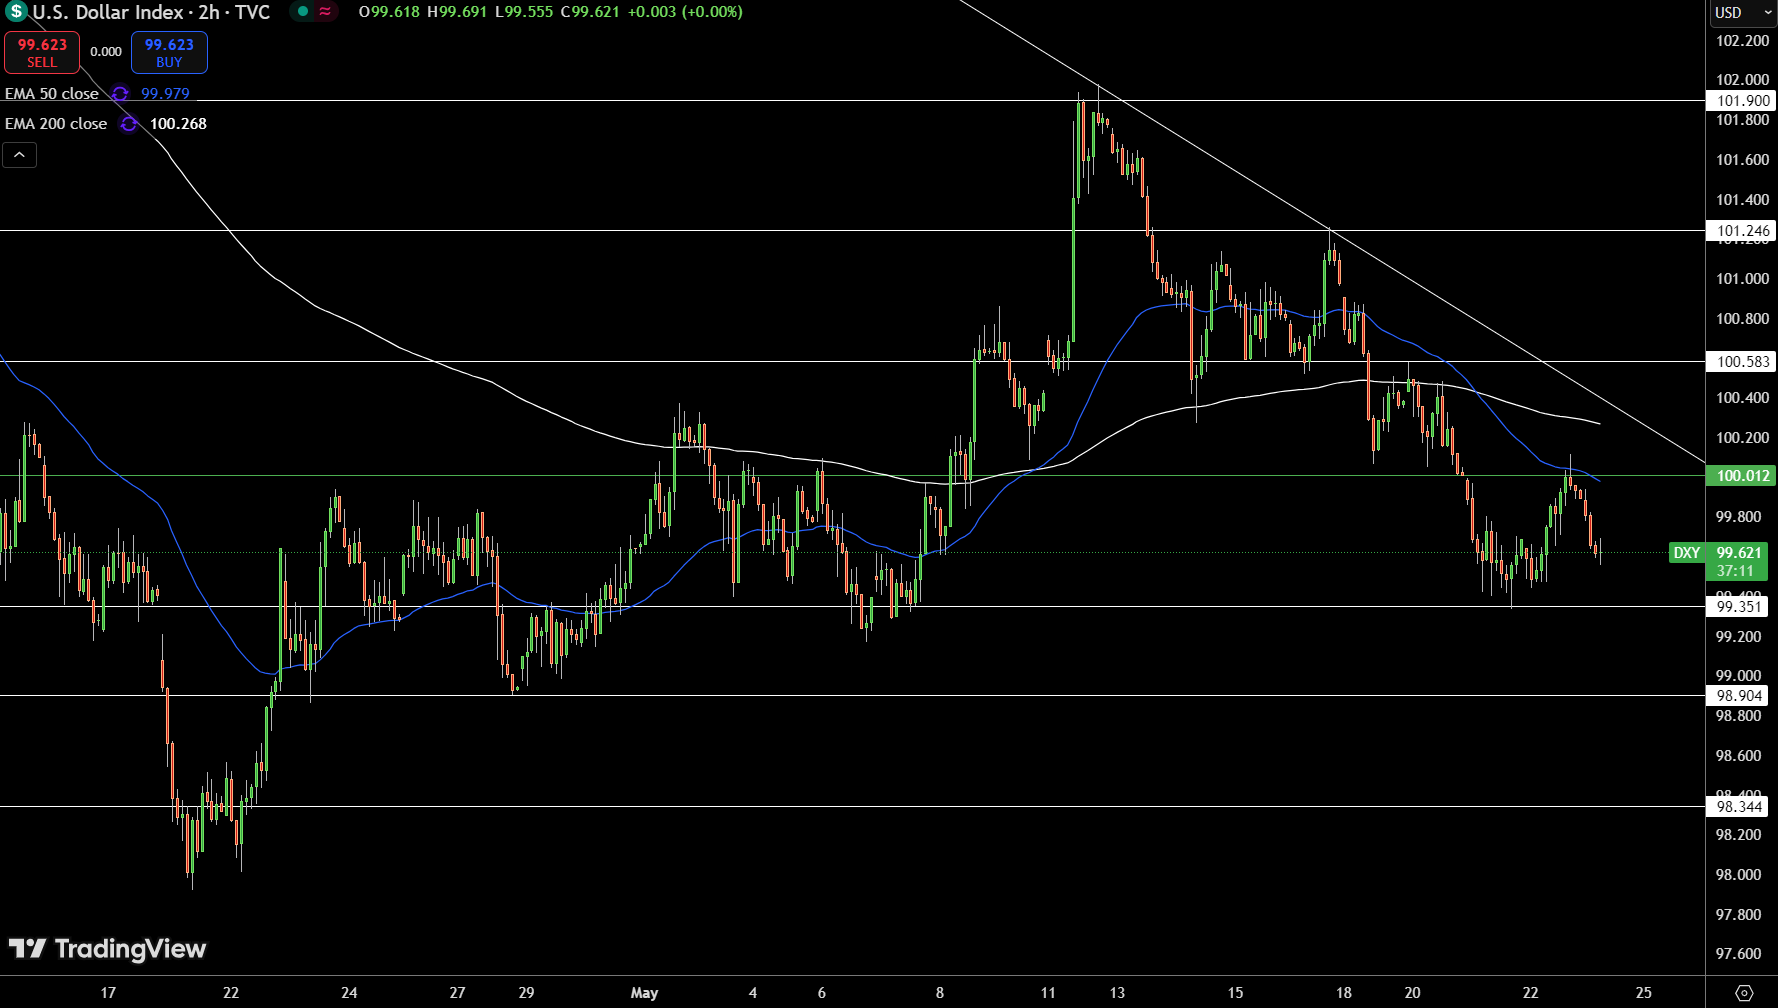
The U.S. Dollar Index (DXY) is struggling to hold ground near $99.62 after facing resistance at $100.01. The rejection occurred just under the 200-EMA at $100.26, adding to downward pressure as price now drifts below the 50-EMA ($99.97).
The broader trend remains bearish, capped by a descending trendline from early May highs. Support rests at $99.35, with a deeper floor at $98.90 if that level gives way.
If bulls want to regain control, a decisive break above $100.58 is needed to shift momentum. For now, short-term bias remains weak, with sellers defending key technical levels and lower highs forming under the trendline.
GBP/USD Technical Analysis
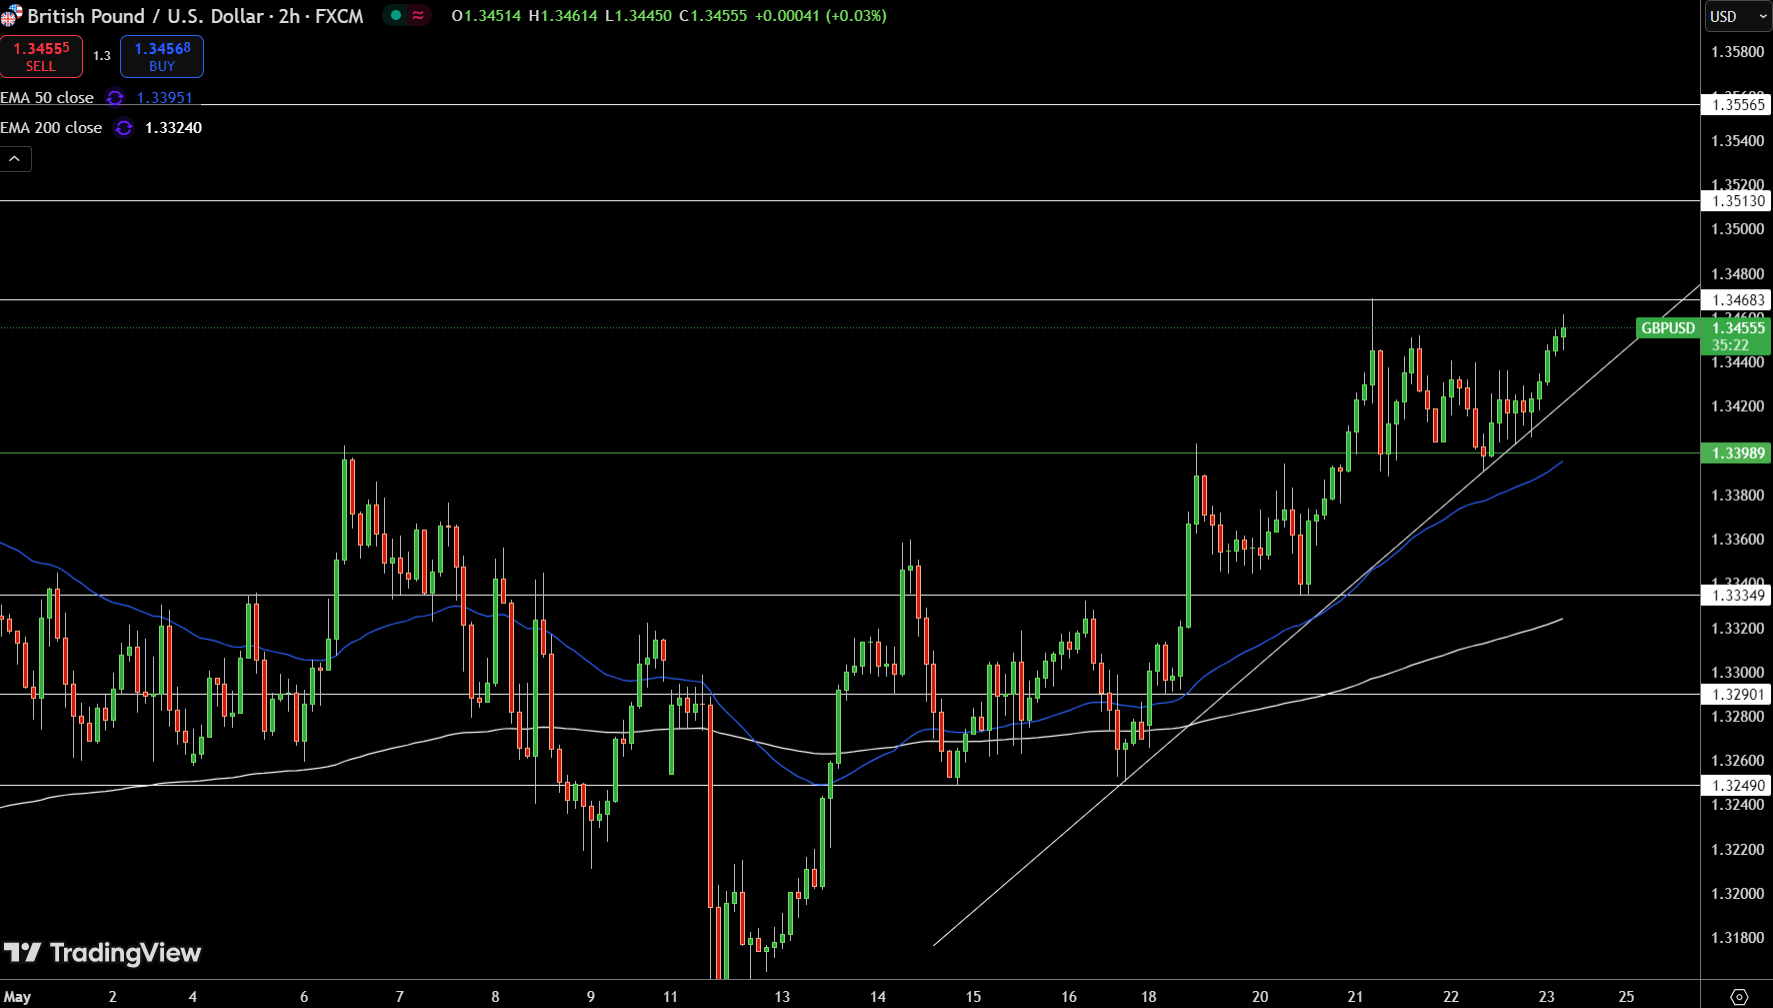
GBP/USD is testing the $1.3468 resistance after climbing steadily from its $1.3399 support base. The pair has maintained a sequence of higher lows while staying above the ascending trendline and both EMAs — the 50-EMA at $1.3395 and 200-EMA at $1.3324 — reinforcing bullish structure.
Price action remains orderly, suggesting healthy demand. A break and hold above $1.3468 would open the door toward $1.3513 and $1.3556 next. A rejection here, however, could send the pair back toward trendline support.
Traders watching for a breakout may look for a strong candle close above resistance to confirm momentum. For now, the trend favors the bulls as long as GBP/USD stays anchored above the $1.3390–$1.3400 zone.
EUR/USD Technical Forecast
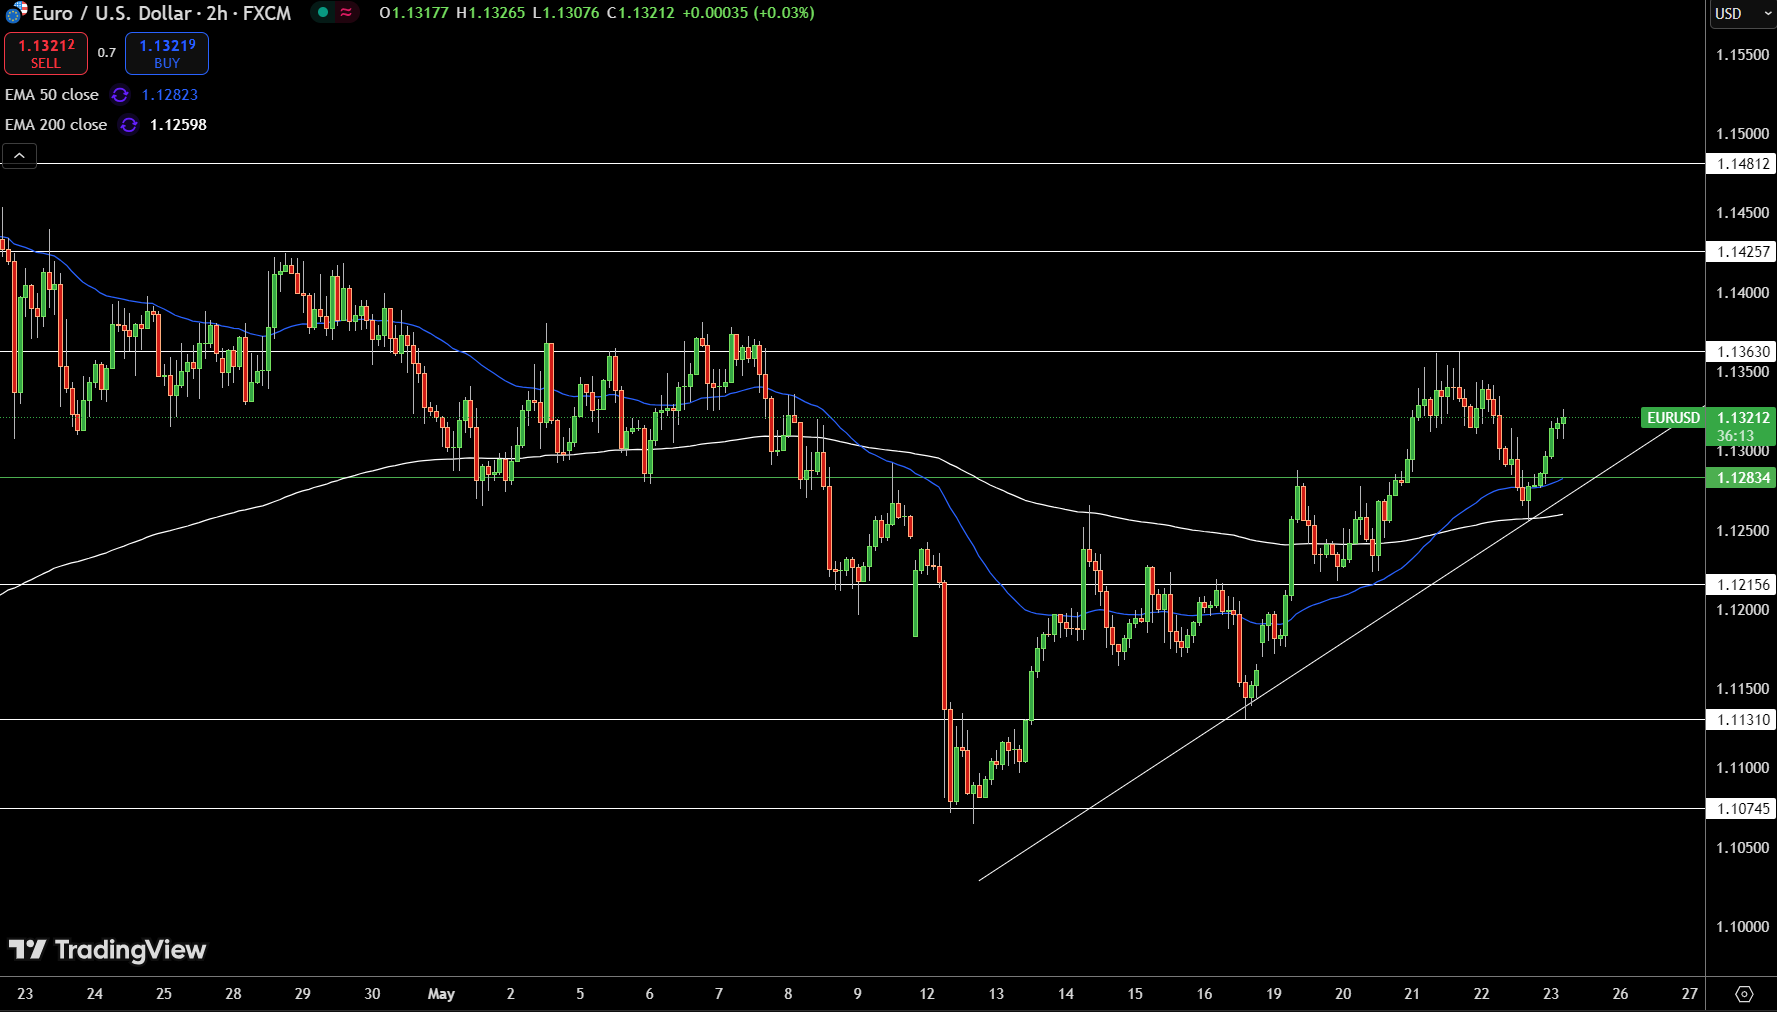
EUR/USD continues to build on its recovery, trading at $1.1321 after bouncing off both trendline and 200-EMA support around $1.1283. Price action is carving out a clean series of higher lows, with the pair now reclaiming territory above the 50-EMA ($1.1282), a sign that short-term sentiment is turning more constructive.
Immediate resistance sits at $1.1363, a level bulls will need to clear to confirm further upside. If that breaks, the next targets are $1.1425 and $1.1481. On the downside, a break below the ascending trendline could invalidate this structure and expose $1.1215.
For now, the technicals suggest a continuation bias as long as price stays above the rising support zone and the 200-EMA.
About the Author
Bob MasonChief Crypto Boss
123456789 30 He has written extensively for a broader audience and his current focus is on developments relating to the financial markets including, but not limited to currencies, commodities, alternative asset classes, and global equities.


Advertisement