
Advertisement
Advertisement
SUI vs. SOL Price Forecast: Which L1 Blockchain Has the Stronger Bull Case?
By:
Key Points:
- SUI and SOL have dropped 14.5% and 6.5% in June, underperforming the broader altcoin market.
- SUI risks a 23% drop toward $2.20 but could rally 45% if it reclaims key resistance.
- SOL eyes a 25% decline toward $110 unless it breaks out of a potential falling wedge pattern.

Layer-1 blockchain assets Sui (SUI) and Solana (SOL) have dropped 14.50% and 6.50%, respectively, in June so far, underperforming the broader altcoin market. New technical structures suggest that both Ethereum rivals may decline further in the coming weeks.
Let’s discuss their bear phase targets while further looking into their potential for long-term price rebounds.
SUI Price Eyes 20-25% Decline by July
SUI risks a deeper decline after confirming a head-and-shoulders breakdown on its daily chart, according to analyst NebraskanGooner.
“Rejected key resistance and now back below 99smma,” he wrote, adding that the SUI’s ongoing structure “also looks like a head and shoulders breakdown,” which may push the prices toward the $2.20 area.
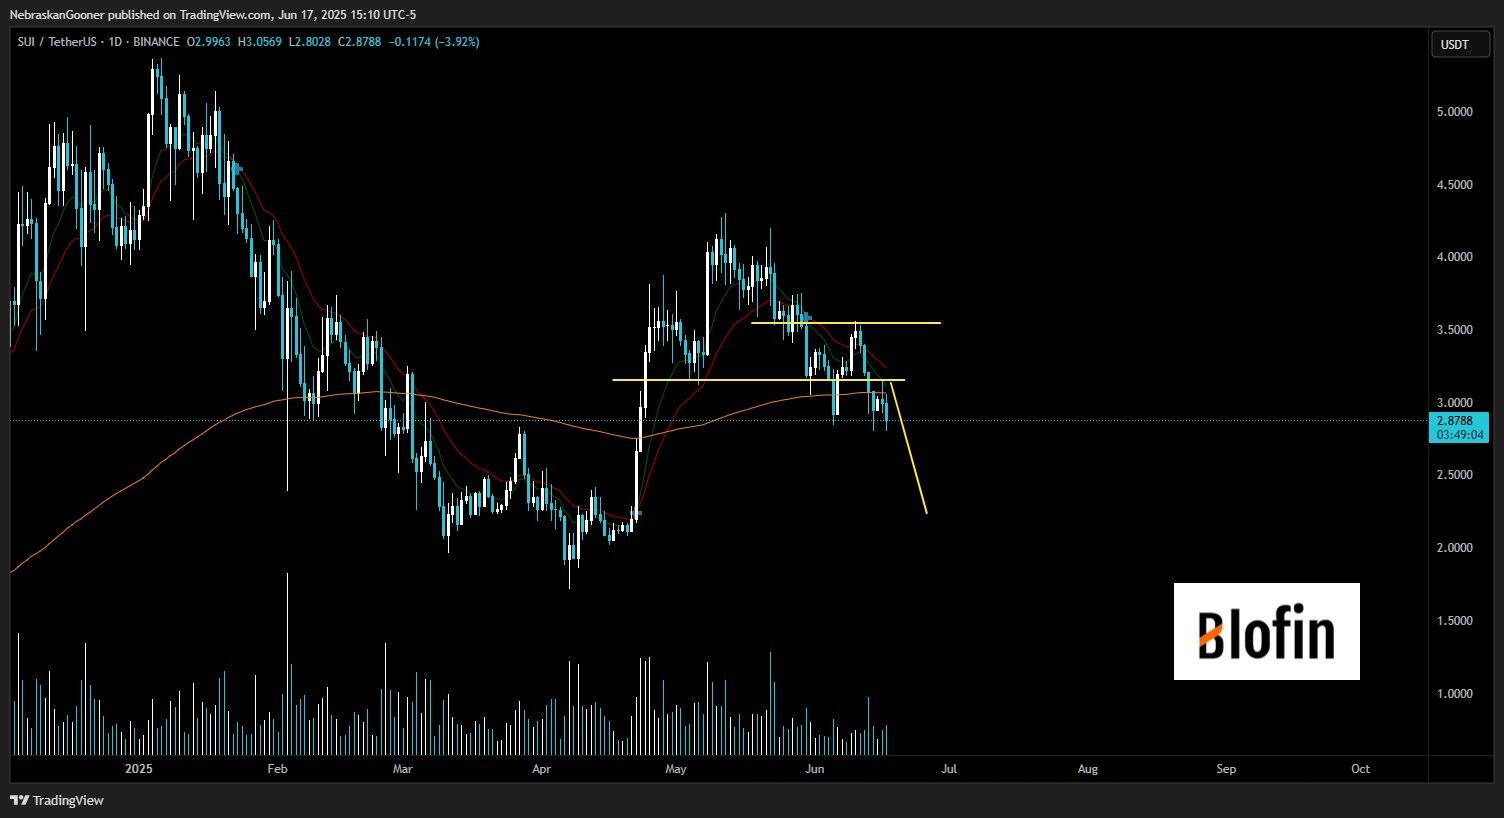
Breaking down the analysis, the SUI crypto dropped below its 99-day simple moving average (SMA) after failing to flip $3.25 into support.
The rejection aligned with the breakdown point of the H&S pattern’s right shoulder, increasing the probability of a measured move toward the $2.20–$2.30 area, down about 23% from current levels, by July.
Traders typically measure the H&S downside target by subtracting the structure’s maximum height from the neckline support level. So, unless bulls reclaim the $3.00–$3.10 neckline zone, the bearish structure could remain dominant in the sessions ahead.
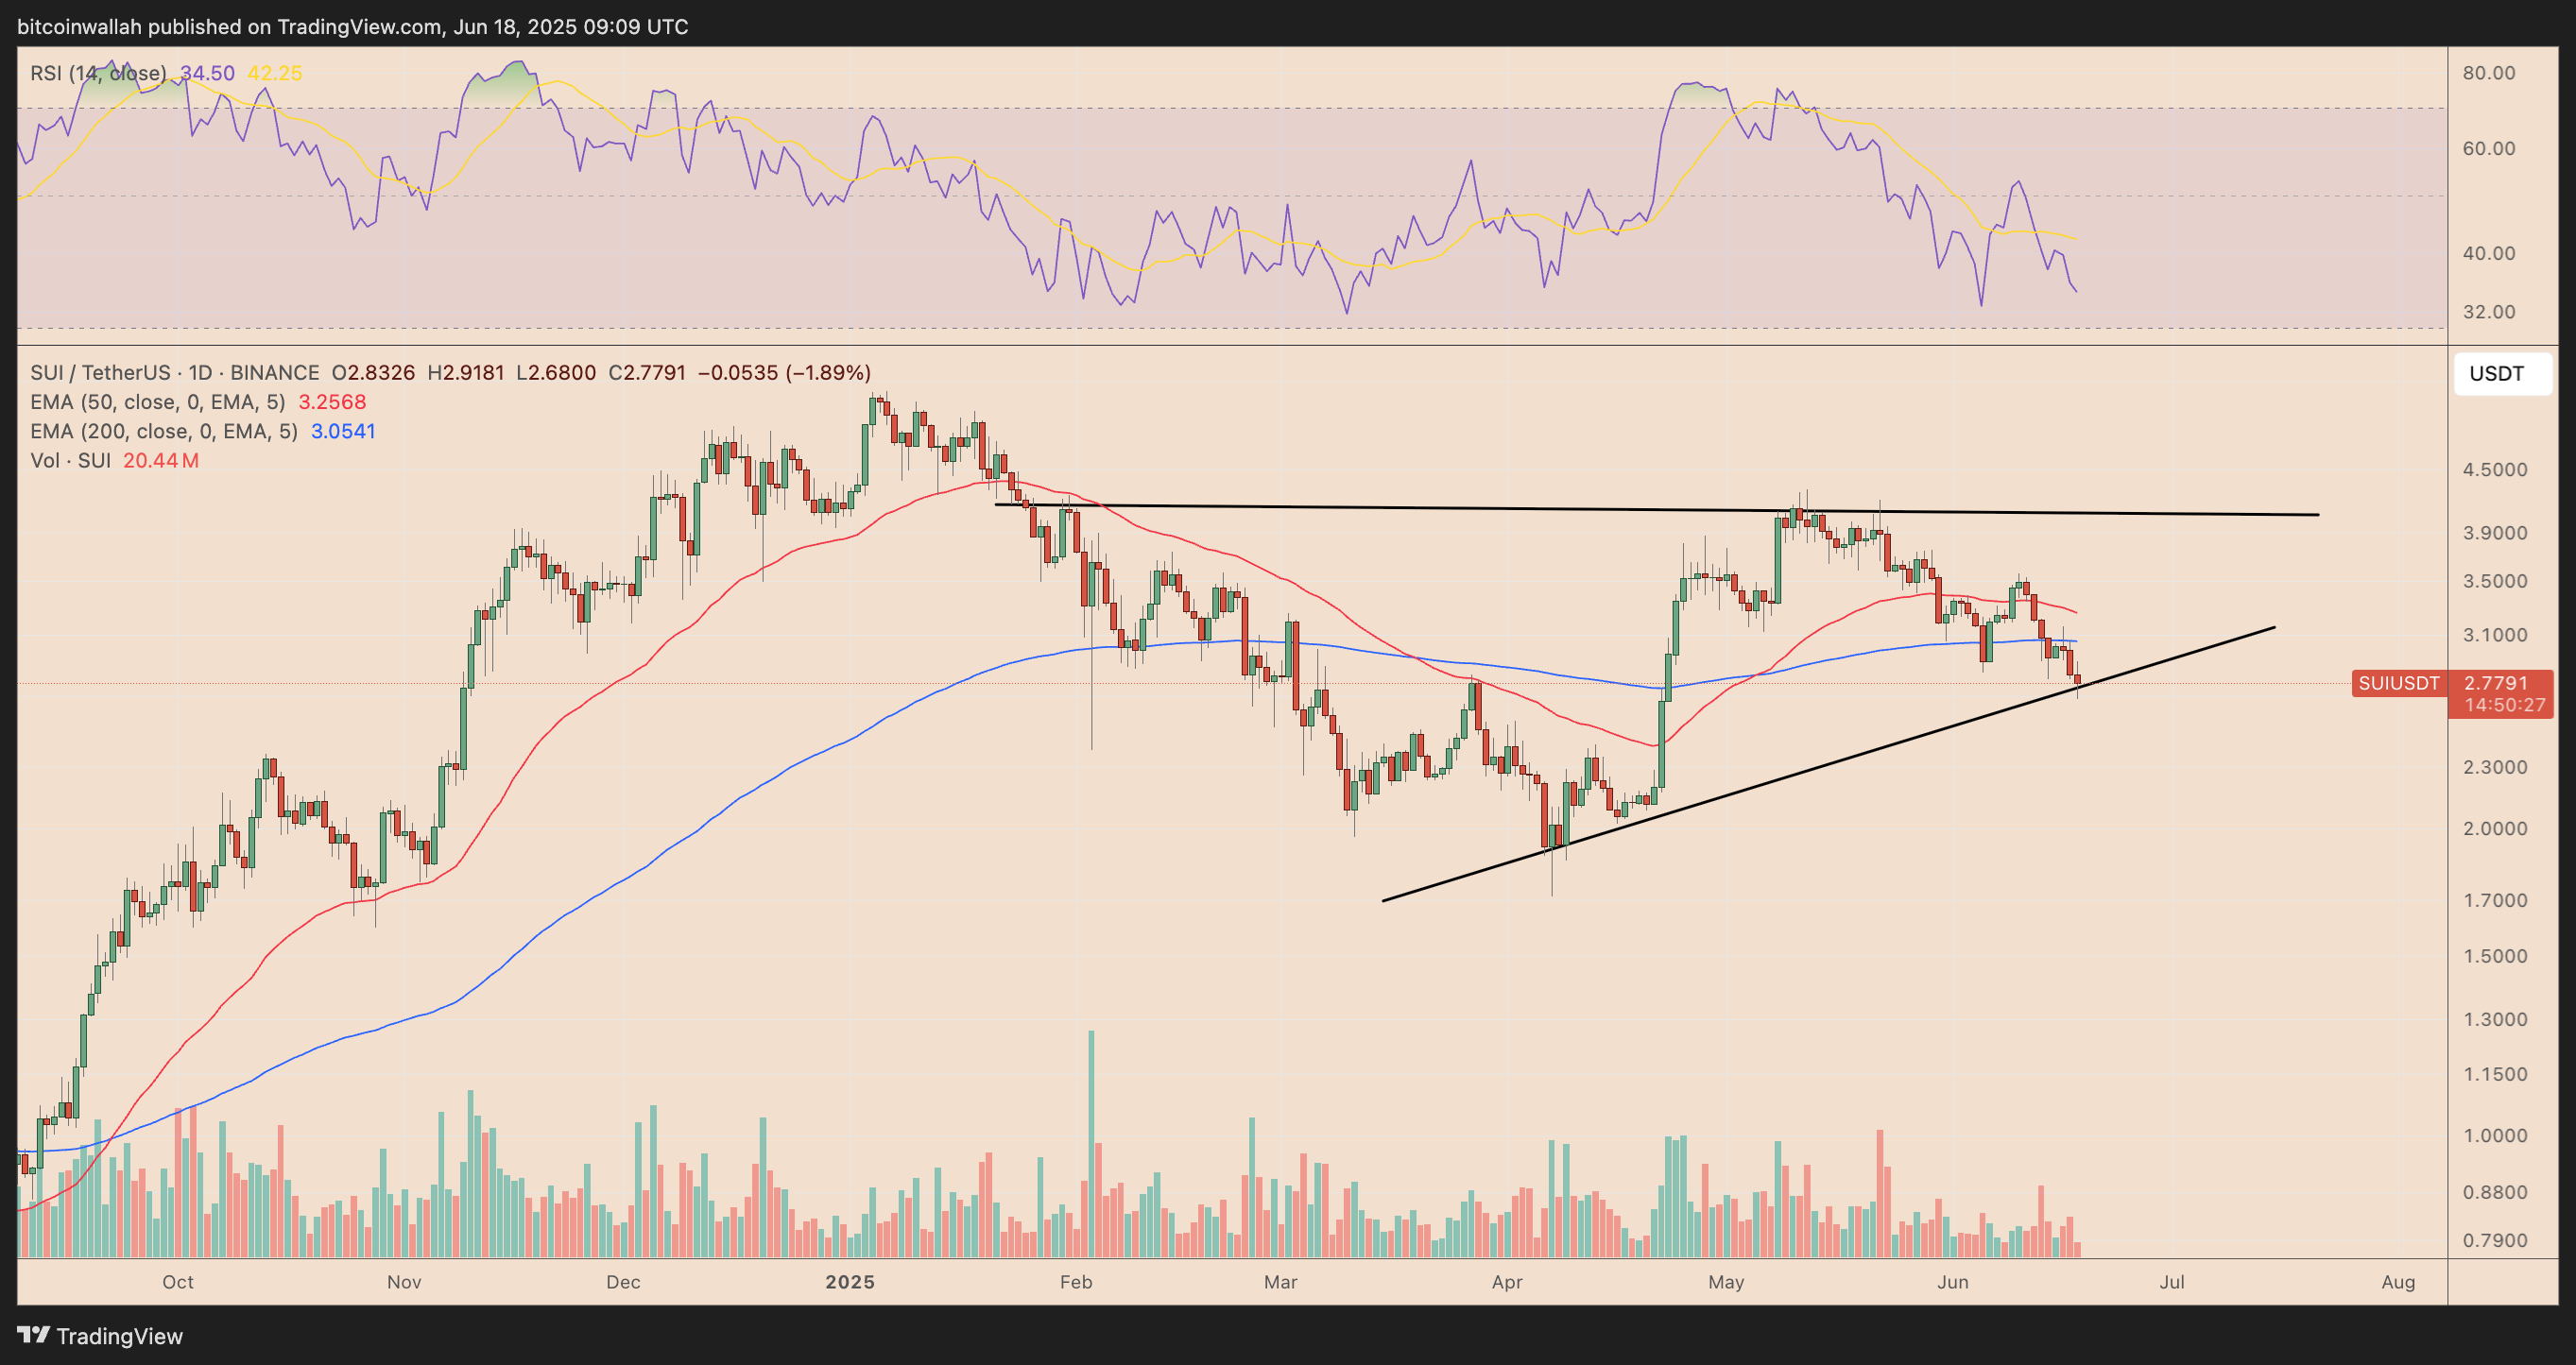
Meanwhile, SUI could validate a broader ascending triangle structure if it breaks above the H&S neckline area, which aligns with the triangle’s lower trendline, as shown below.
Should it happen, SUI could recover toward the triangle’s upper trendline by July, aligning with the $4.10 level. That is about 45% above current price levels.
Solana Descending Triangle Targets $110 Breakdown
Solana trades inside a descending triangle pattern, typically a bearish continuation setup, with support around the $142–$145 range.
As of June 18, the price sits just above this key horizontal level, while lower highs since May indicate growing downside pressure. A confirmed breakdown below support would activate a measured target near $110, down roughly 25% from current prices.

The bearish bias strengthens further as SOL trades below its 50-day and 200-day EMAs. RSI also remains weak, hovering around 43, signaling limited upside momentum.
Conversely, a clear bounce from the triangle’s lower trendline increases the odds of the structure being a falling wedge. Technically, such wedges are considered bullish reversal patterns.
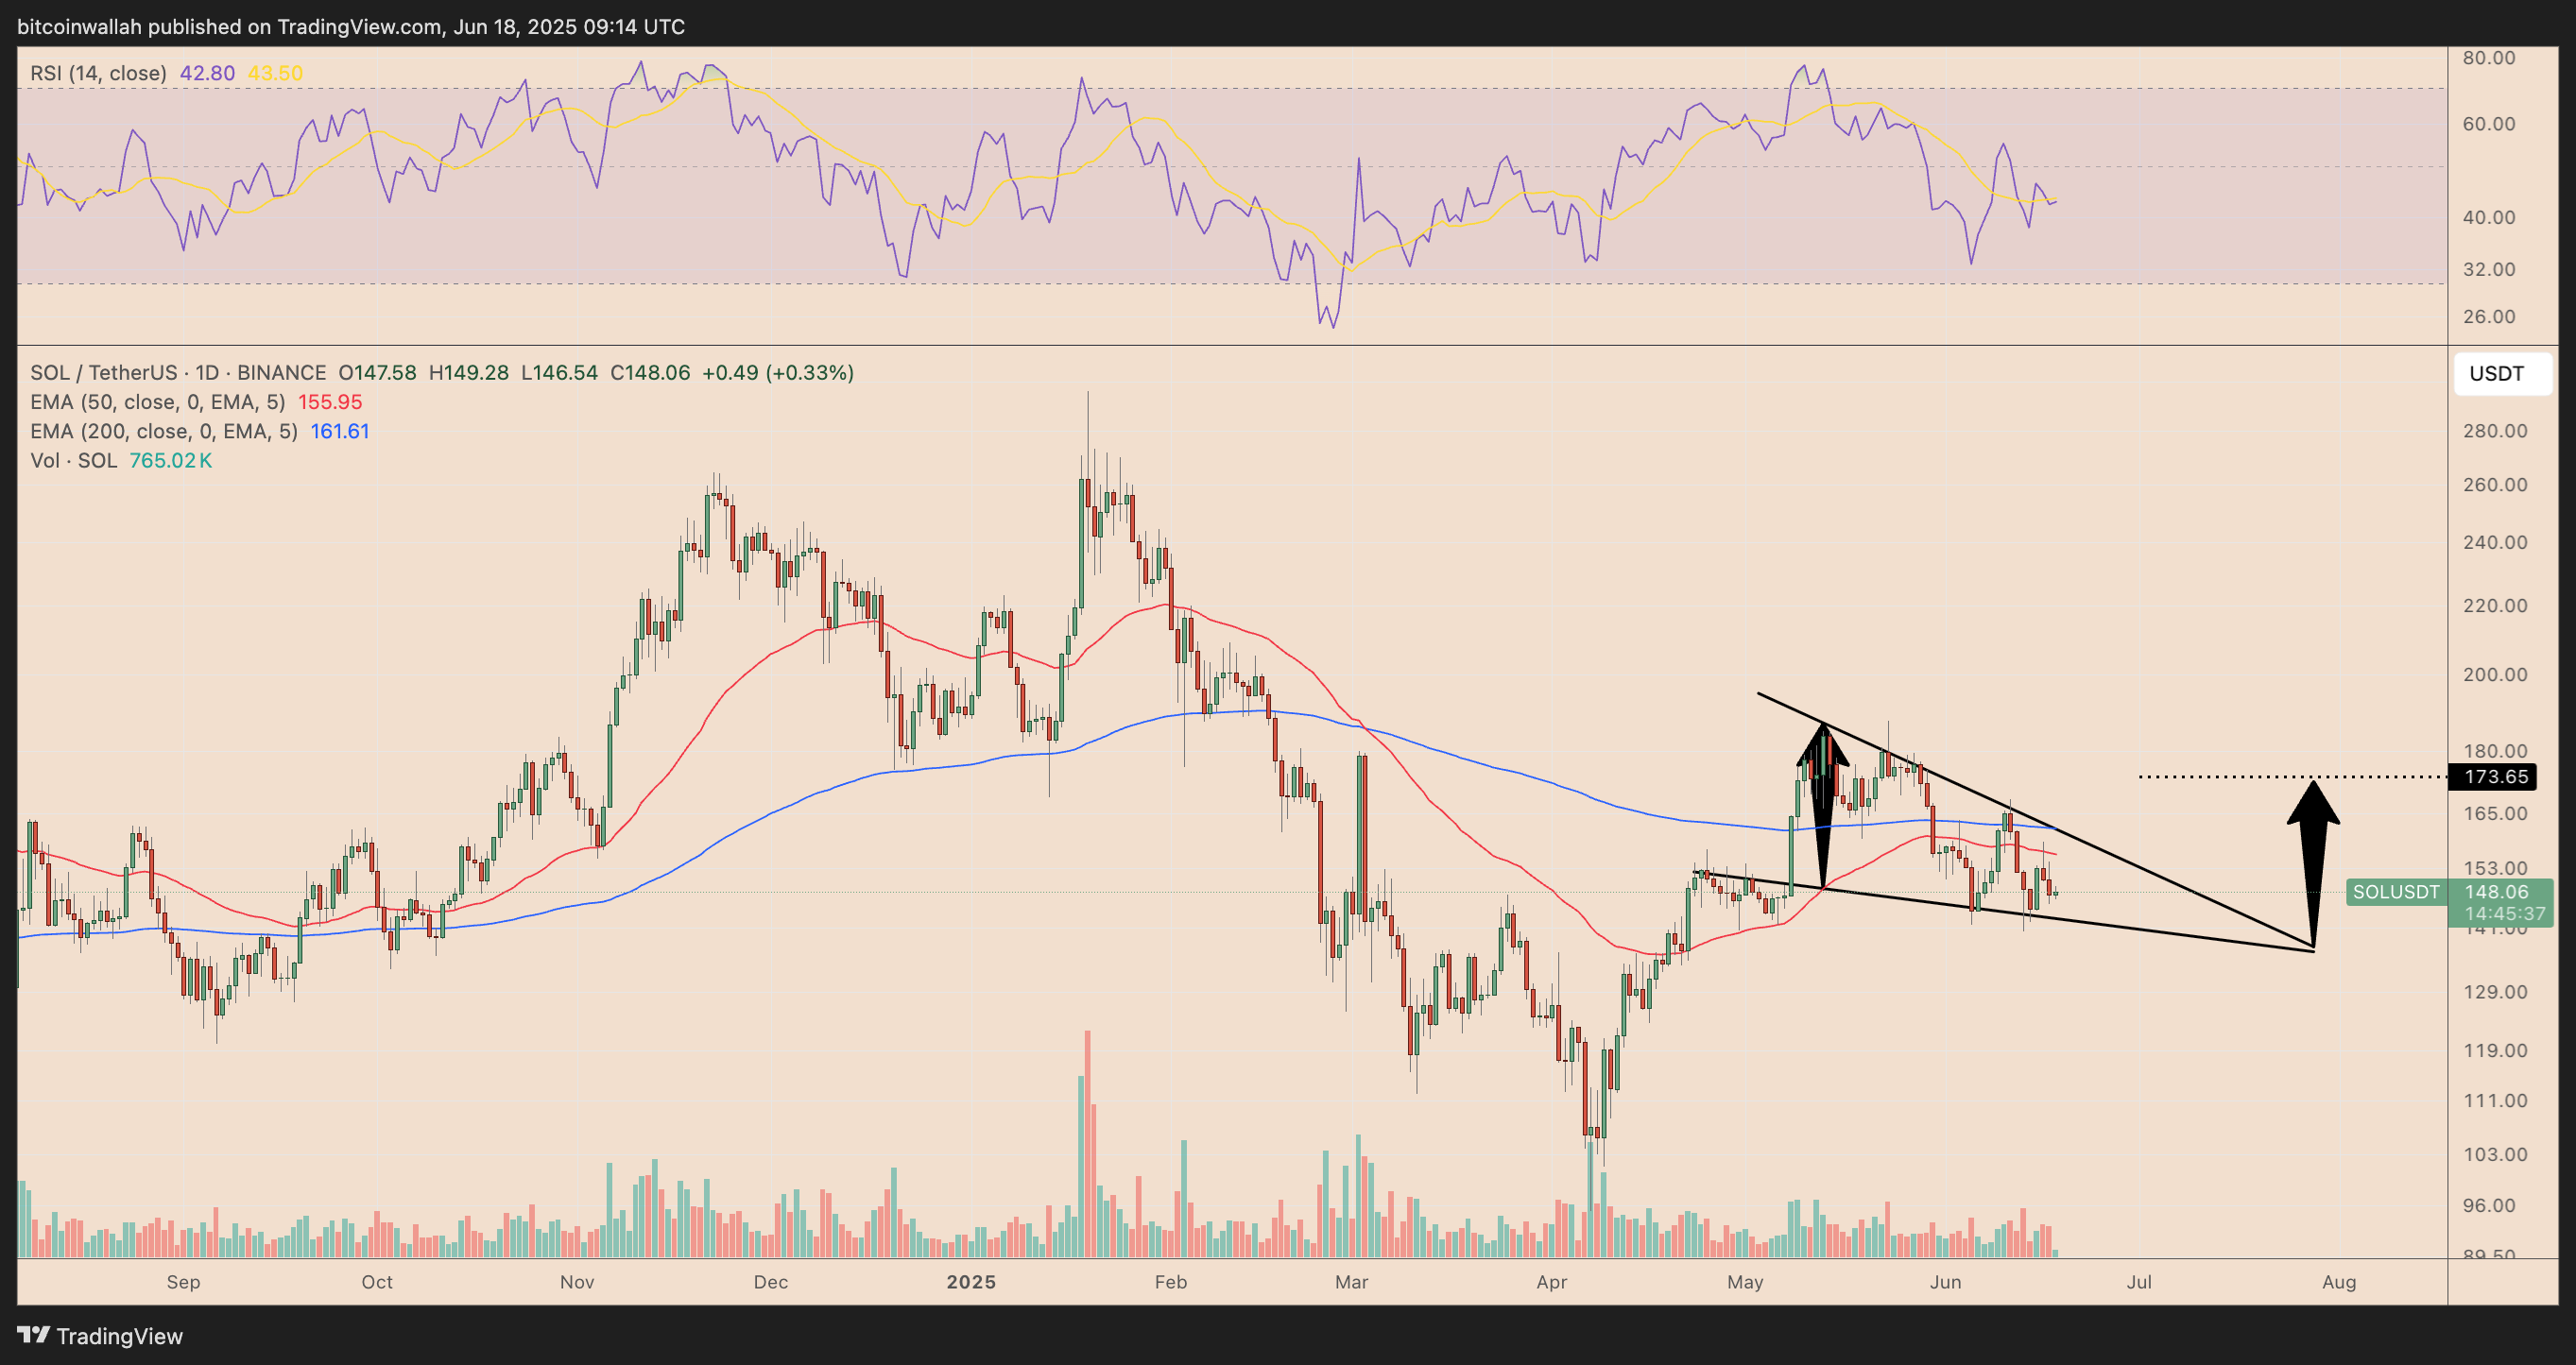
Should the wedge pattern play out instead of a descending triangle, SOL’s upside target appears to be around $173.65, up 17% from the current price levels.
Both SUI and SOL face similar downside risks, but SUI’s bullish reversal setups offer a stronger risk-reward profile compared to Solana.
About the Author
Bob MasonChief Crypto Boss
123456789 30 He has written extensively for a broader audience and his current focus is on developments relating to the financial markets including, but not limited to currencies, commodities, alternative asset classes, and global equities.


Advertisement