
Advertisement
Advertisement
Physical Gold vs. Digital Gold: BTC Nears Record Highs, XAUUSD Builds for Next Surge
By:
Key Points:
- Gold (XAUUSD) continues its bullish momentum after finding support at the $3,120 zone.
- Bitcoin (BTC) looks to break new record highs after forming a solid support base.
- The Bitcoin (BTC) to Gold (XAU) ratio signals a potential long-term breakout in Bitcoin prices.

Bitcoin (BTC) prices continue to rally toward record highs as optimism grows over a potential Russia-Ukraine ceasefire following President Trump’s call with President Putin. His proposal for peace talks at the Vatican boosted global risk appetite, fueling gains across major cryptocurrencies. Despite Moody’s downgrade of the US credit rating, Bitcoin quickly recovered.
HSBC highlighted that the recent US-China trade truce has permanently lifted global risk sentiment. This shift has enabled Bitcoin to thrive even amid negative fiscal news. Retail investors remain a driving force behind the rally. Bitcoin continues to climb, while Fed policy uncertainty and slower US economic growth are largely ignored.
On the other hand, safe-haven demand for gold (XAU) remains supported by long-term concerns over US fiscal health. However, Bitcoin’s rally has attracted more speculative capital, leaving gold prices largely range-bound. Even with headlines of record-breaking crypto hacks and rising regulatory risks, investor appetite for digital assets remains strong, signaling a shift away from physical assets like gold. Unless geopolitical tensions intensify or real yields decline, gold may continue to underperform relative to surging Bitcoin in the near term.
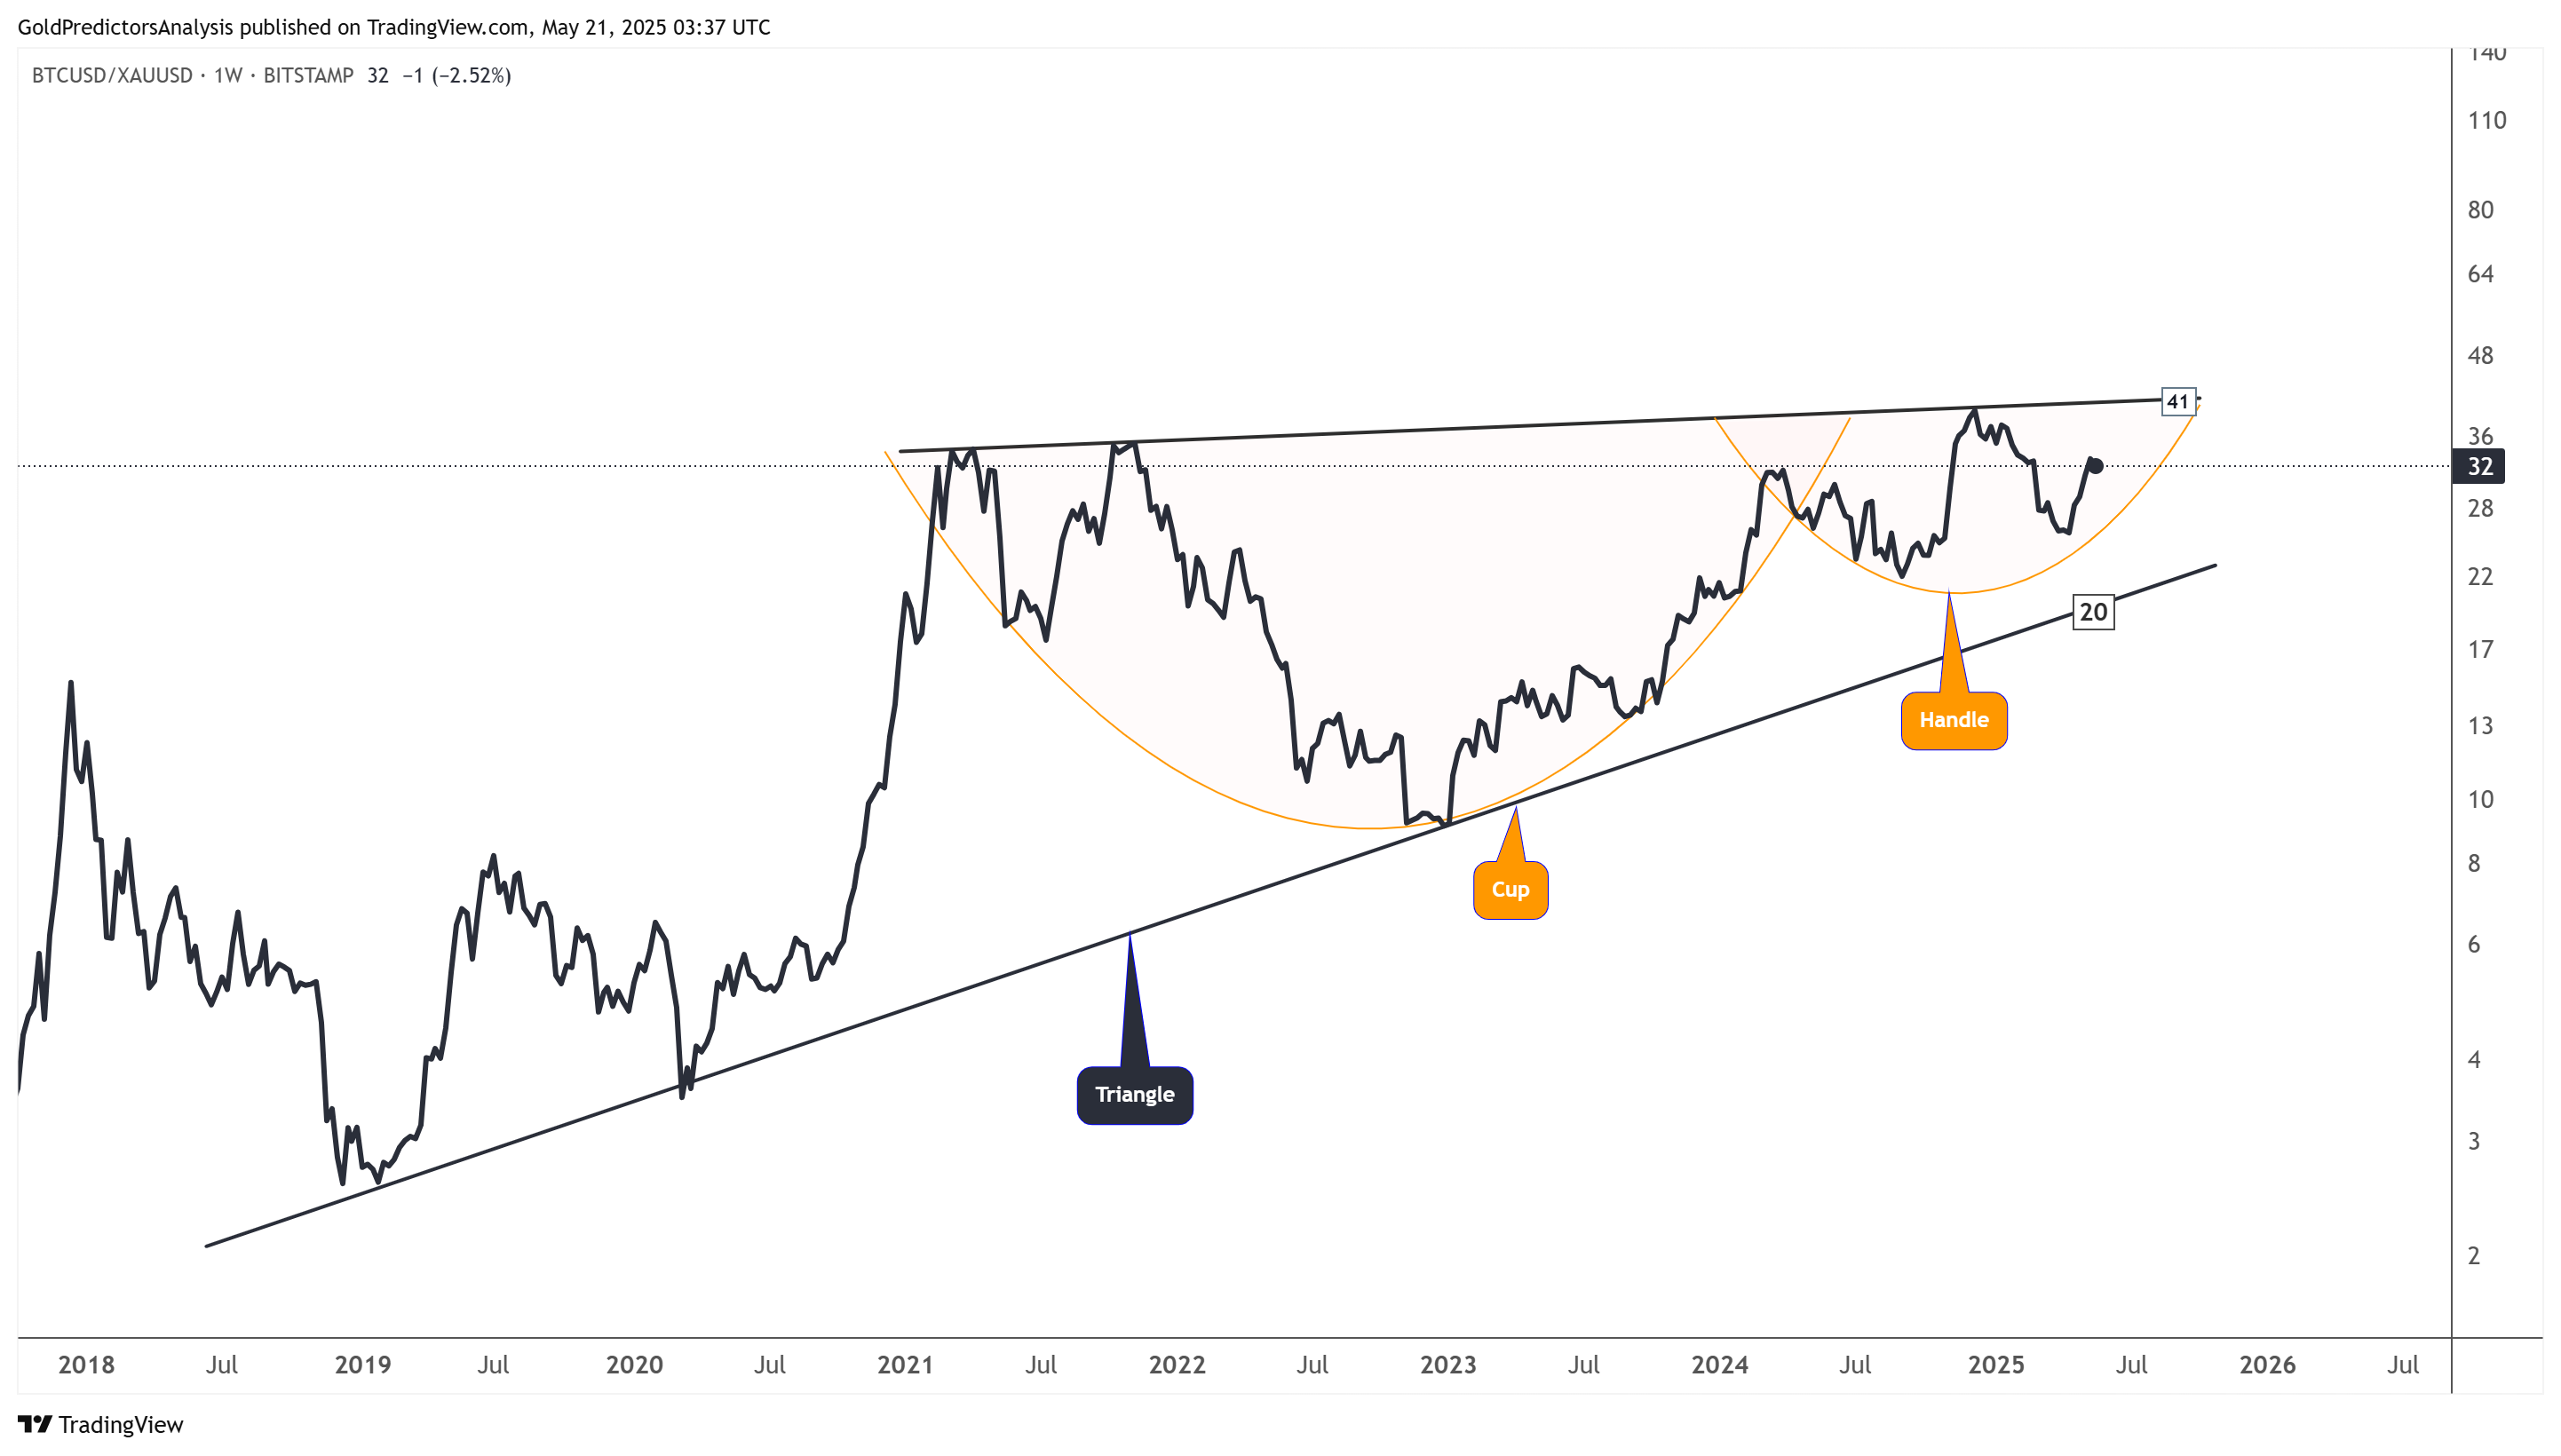
Bitcoin-to-Gold Ratio Forms Cup and Handle Pattern, Eyes Surge Above Key Level
The weekly chart for the Bitcoin-to-Gold ratio shows that the ratio has been trading within an ascending channel since 2013. It has developed strong bullish price action within this channel, with notable peaks in 2017 and 2021 aligning with Bitcoin price tops. After forming a high in 2021, the ratio entered a consolidation phase, forming a cup and handle pattern. A breakout from this pattern would signal continued upward momentum in Bitcoin prices. The ratio is currently trading at the edge of the breakout zone. If the breakout occurs, the ratio will likely move toward the upper resistance of the ascending channel. This move could drive Bitcoin to new record highs.
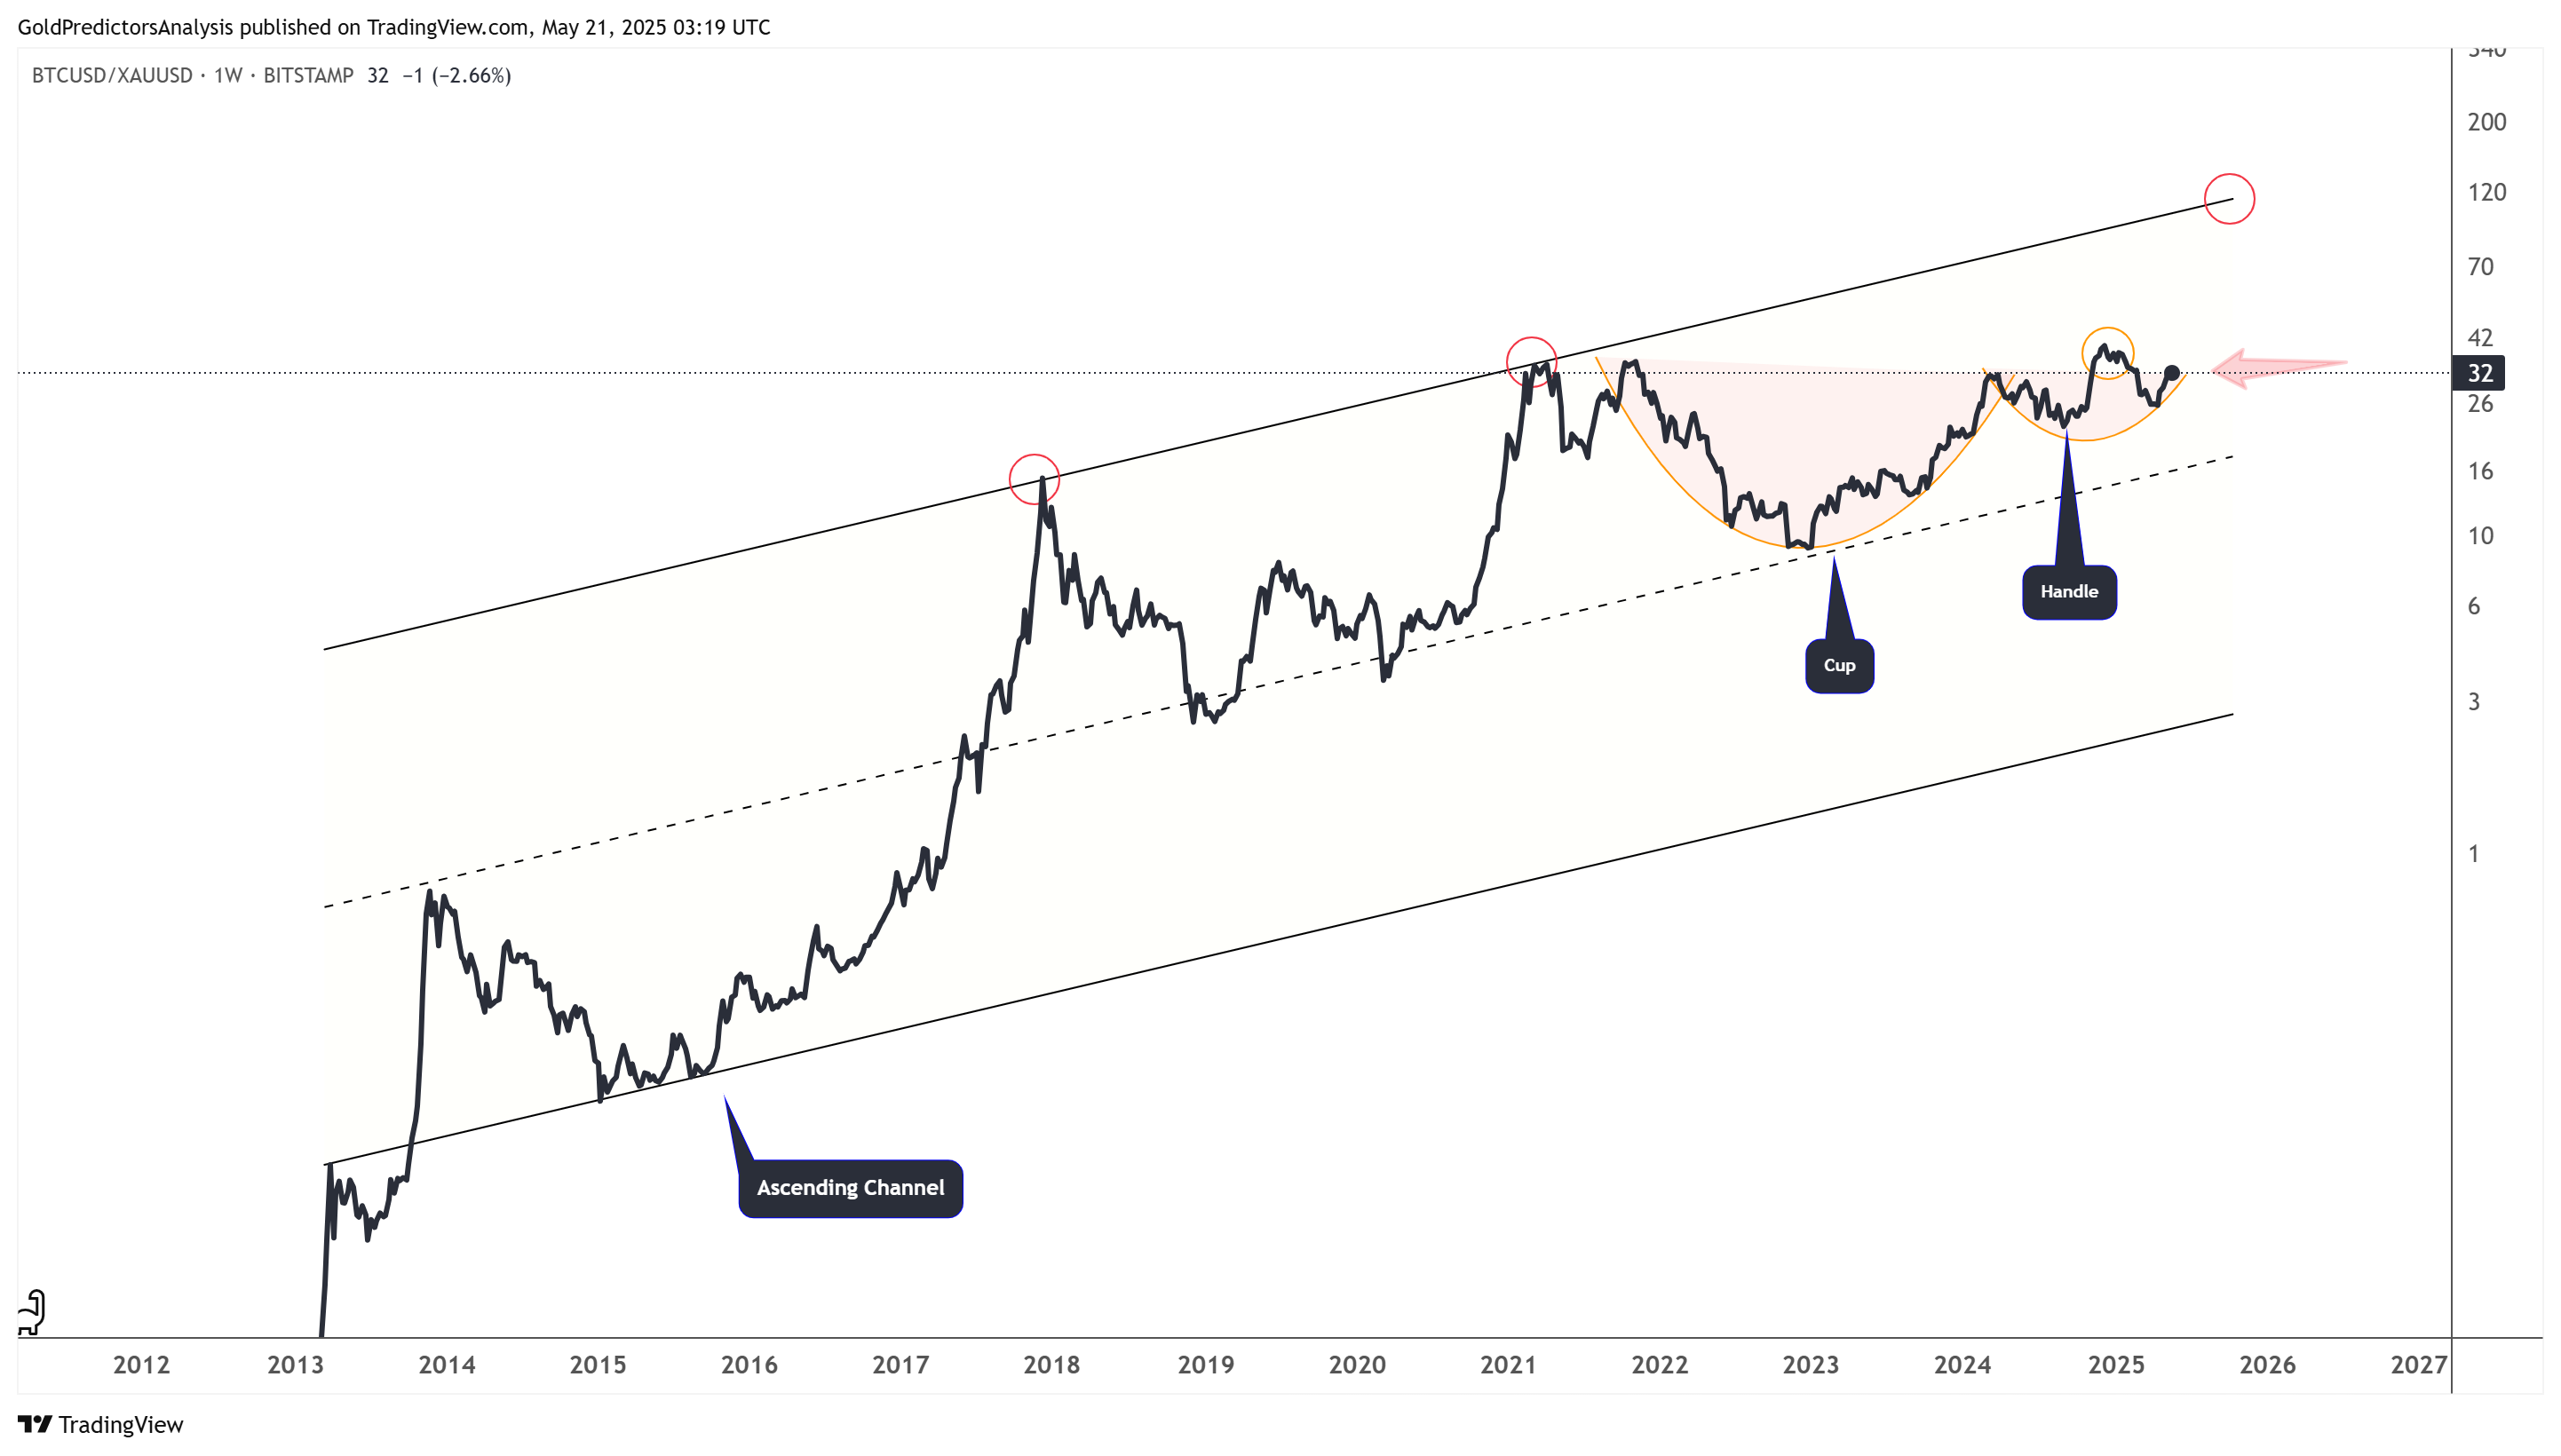
The cup and handle pattern is highlighted in the chart below. It shows that the ratio is currently trading within the handle formation. A breakout above the 41 area would likely trigger a new surge in Bitcoin prices. Bitcoin is already trading near record levels, and a breakout in this ratio could signal the start of a fresh rally. The chart also shows that the ratio forms a triangle pattern, making the 41 level a critical decision zone.
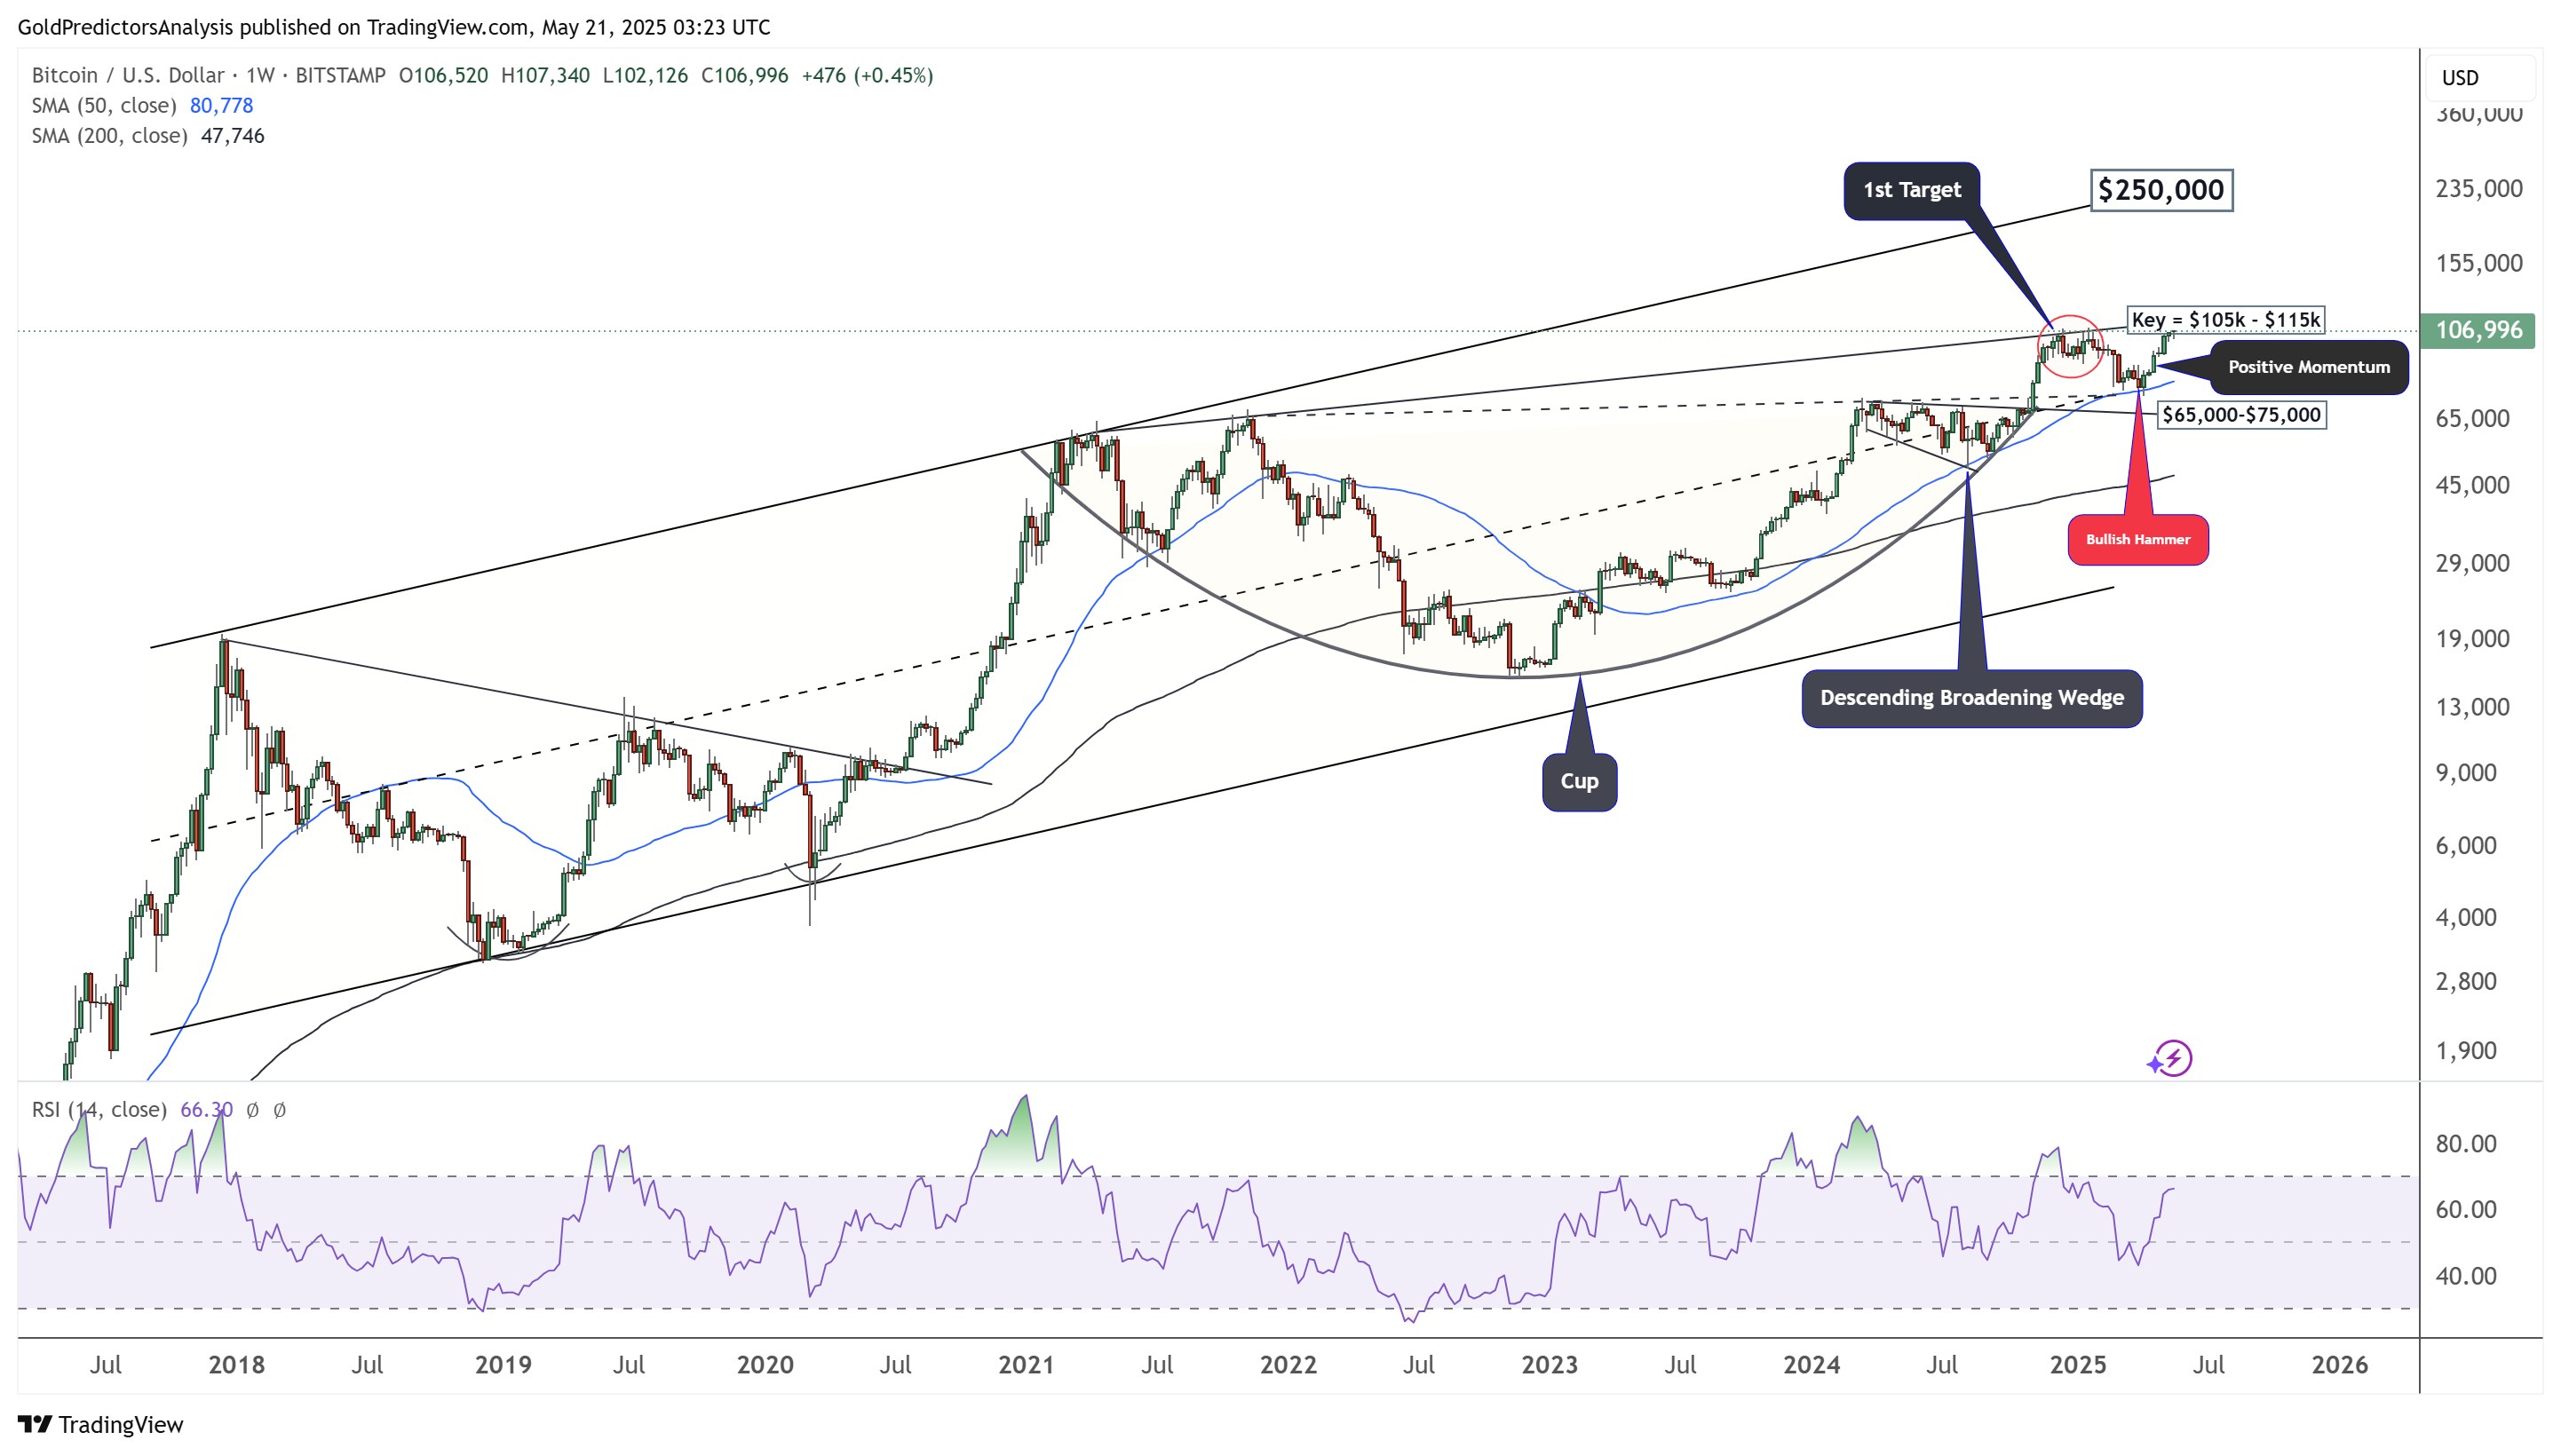
Bitcoin (BTC) Technical Analysis – Bullish Patterns Signal Surge Toward Record Levels
The weekly chart for Bitcoin shows that the price is approaching the record level above $105,000. If a breakout occurs above this level, it would set the stage for the next move higher. Notably, strong resistance lies between $105,000 and $115,000. Furthermore, strong bullish momentum is highlighted by a cup pattern, a descending broadening wedge, and a bullish hammer at the 50-day SMA. Together, these patterns suggest that prices will likely break toward new record highs.
Gold (XAUUSD) Technical Analysis – Consolidation Sets Stage for Breakout
The weekly chart for gold shows that the price consolidated from 2020 to 2024, forming an inverted head and shoulders pattern. This is a highly bullish formation, and the breakout above $2,075 in 2024 triggered a strong rally in gold prices. The rally entered a parabolic phase, where each consolidation led to a sharp surge. The price reached a record high of $3,500 before correcting to $3,200, forming a consolidation range. A breakout above $3,500 would signal the next upward move for gold prices.
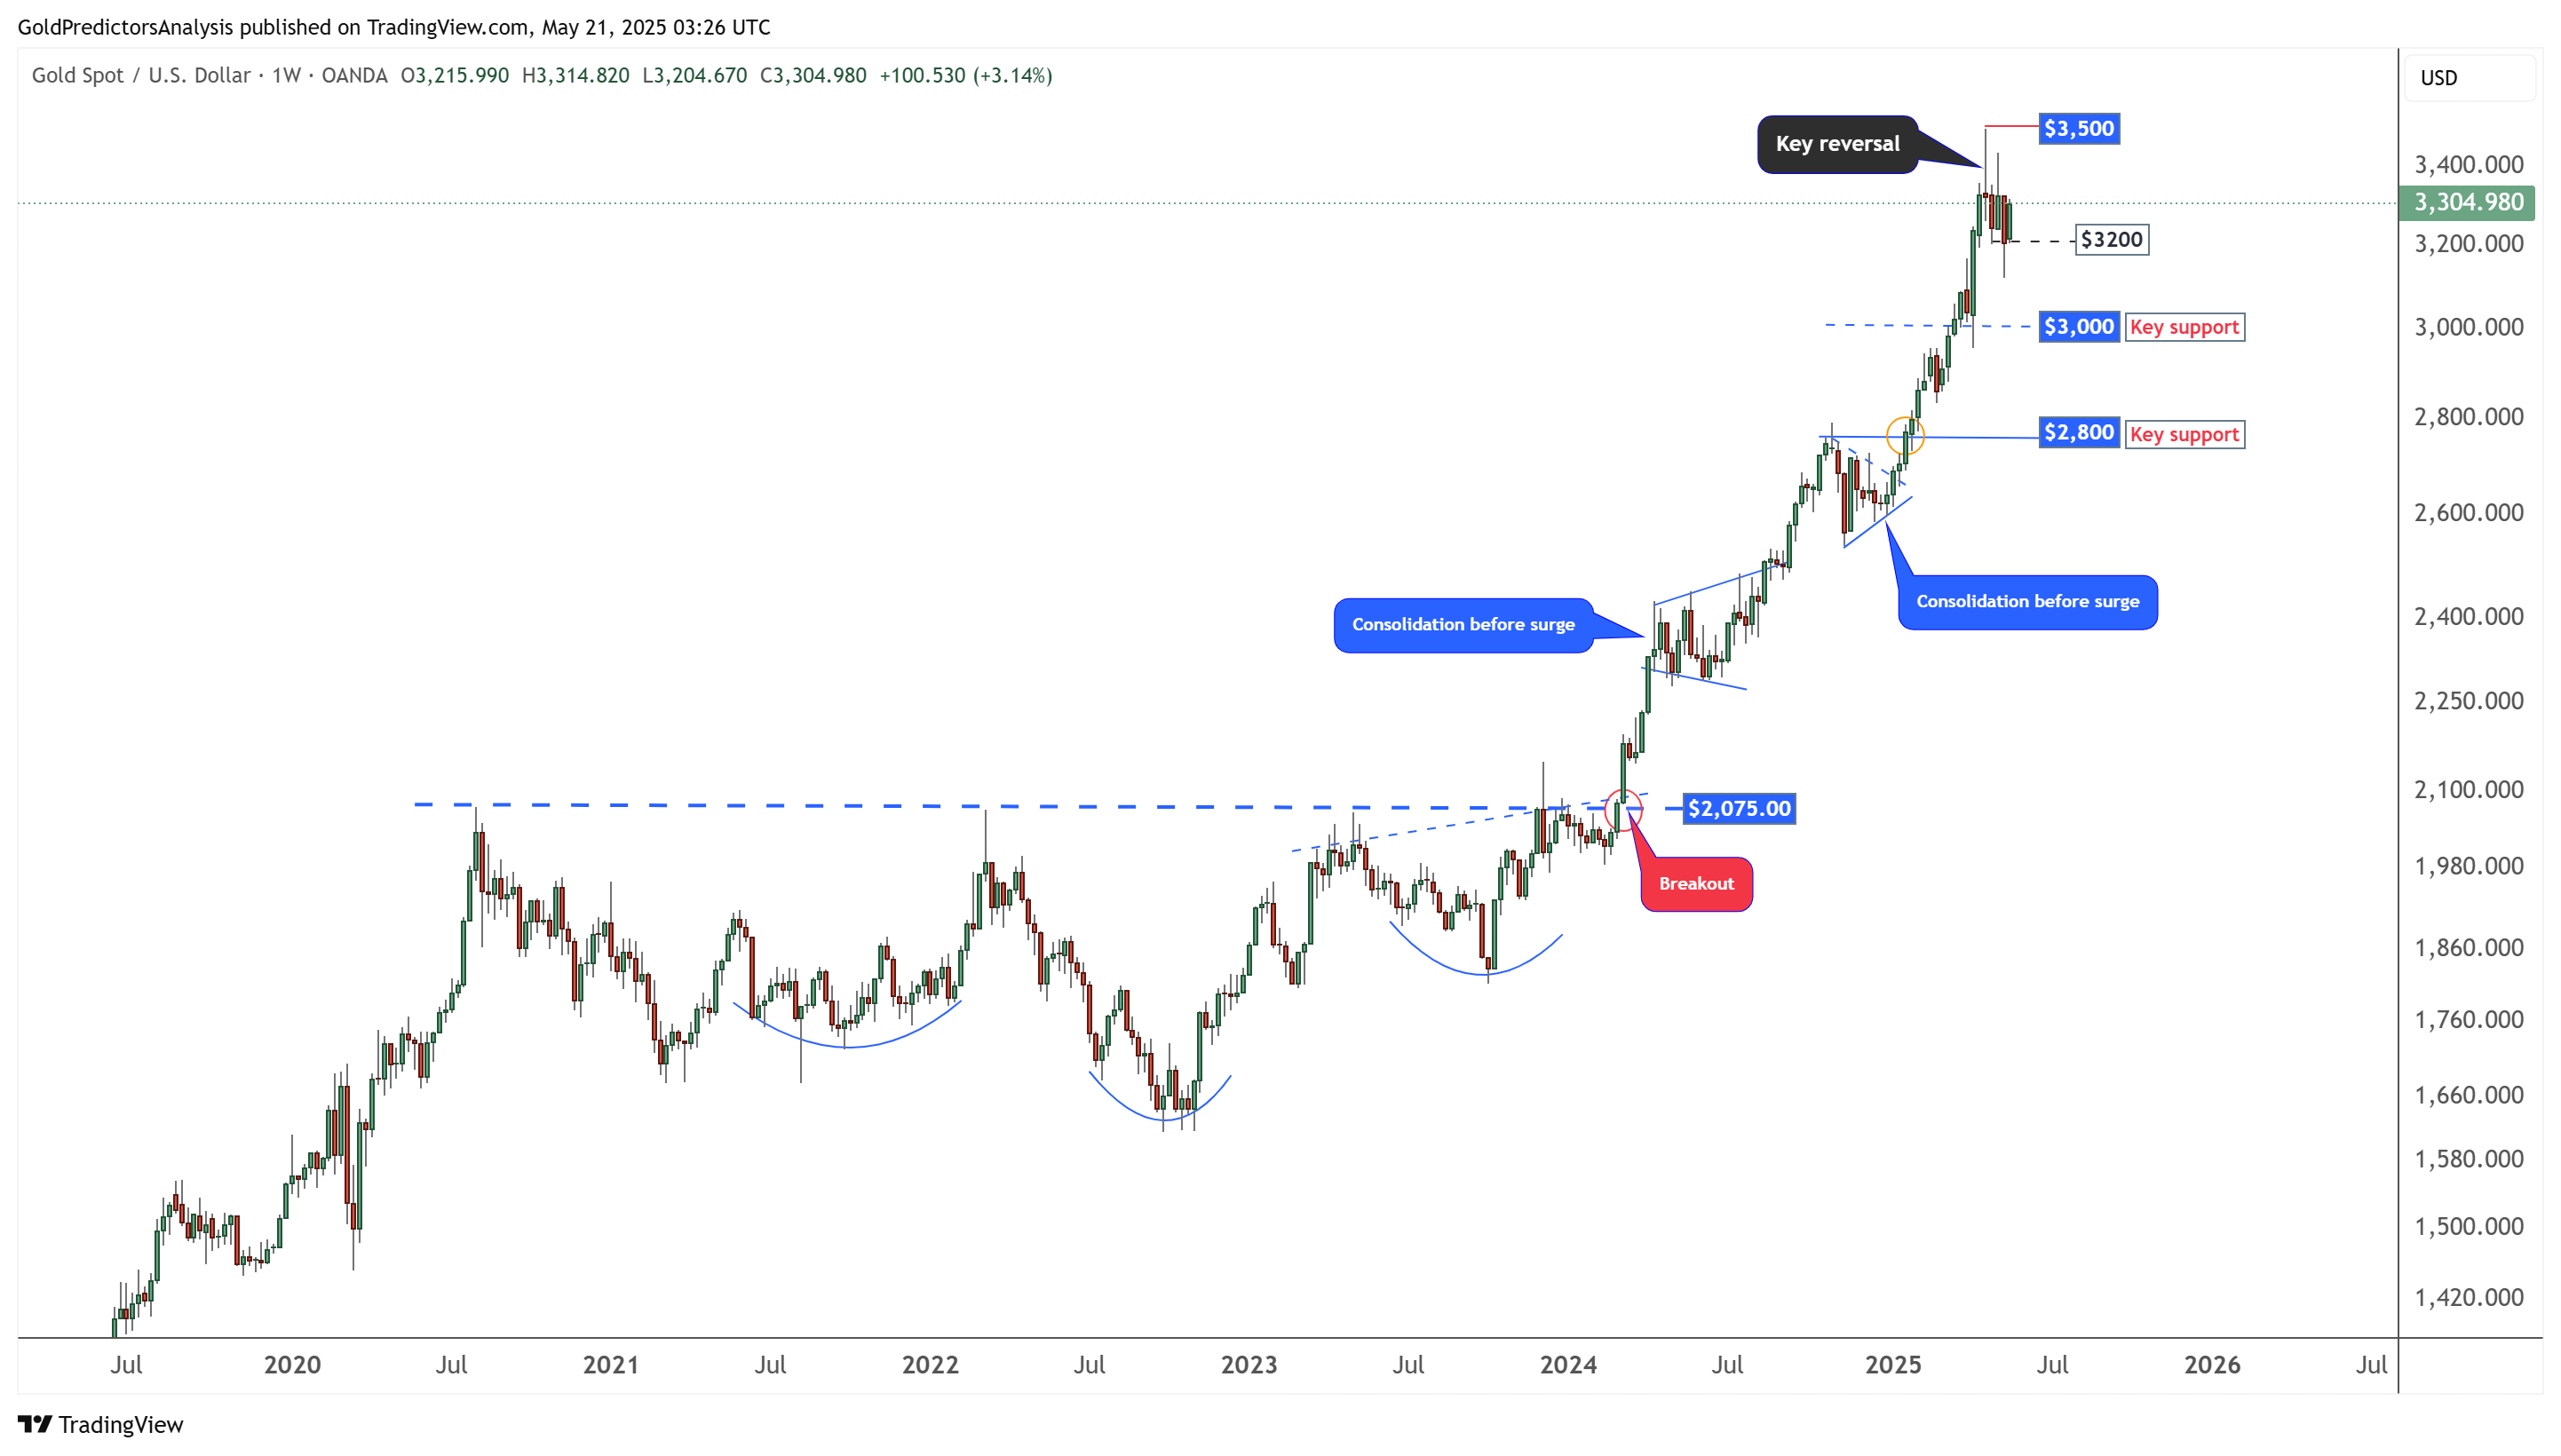
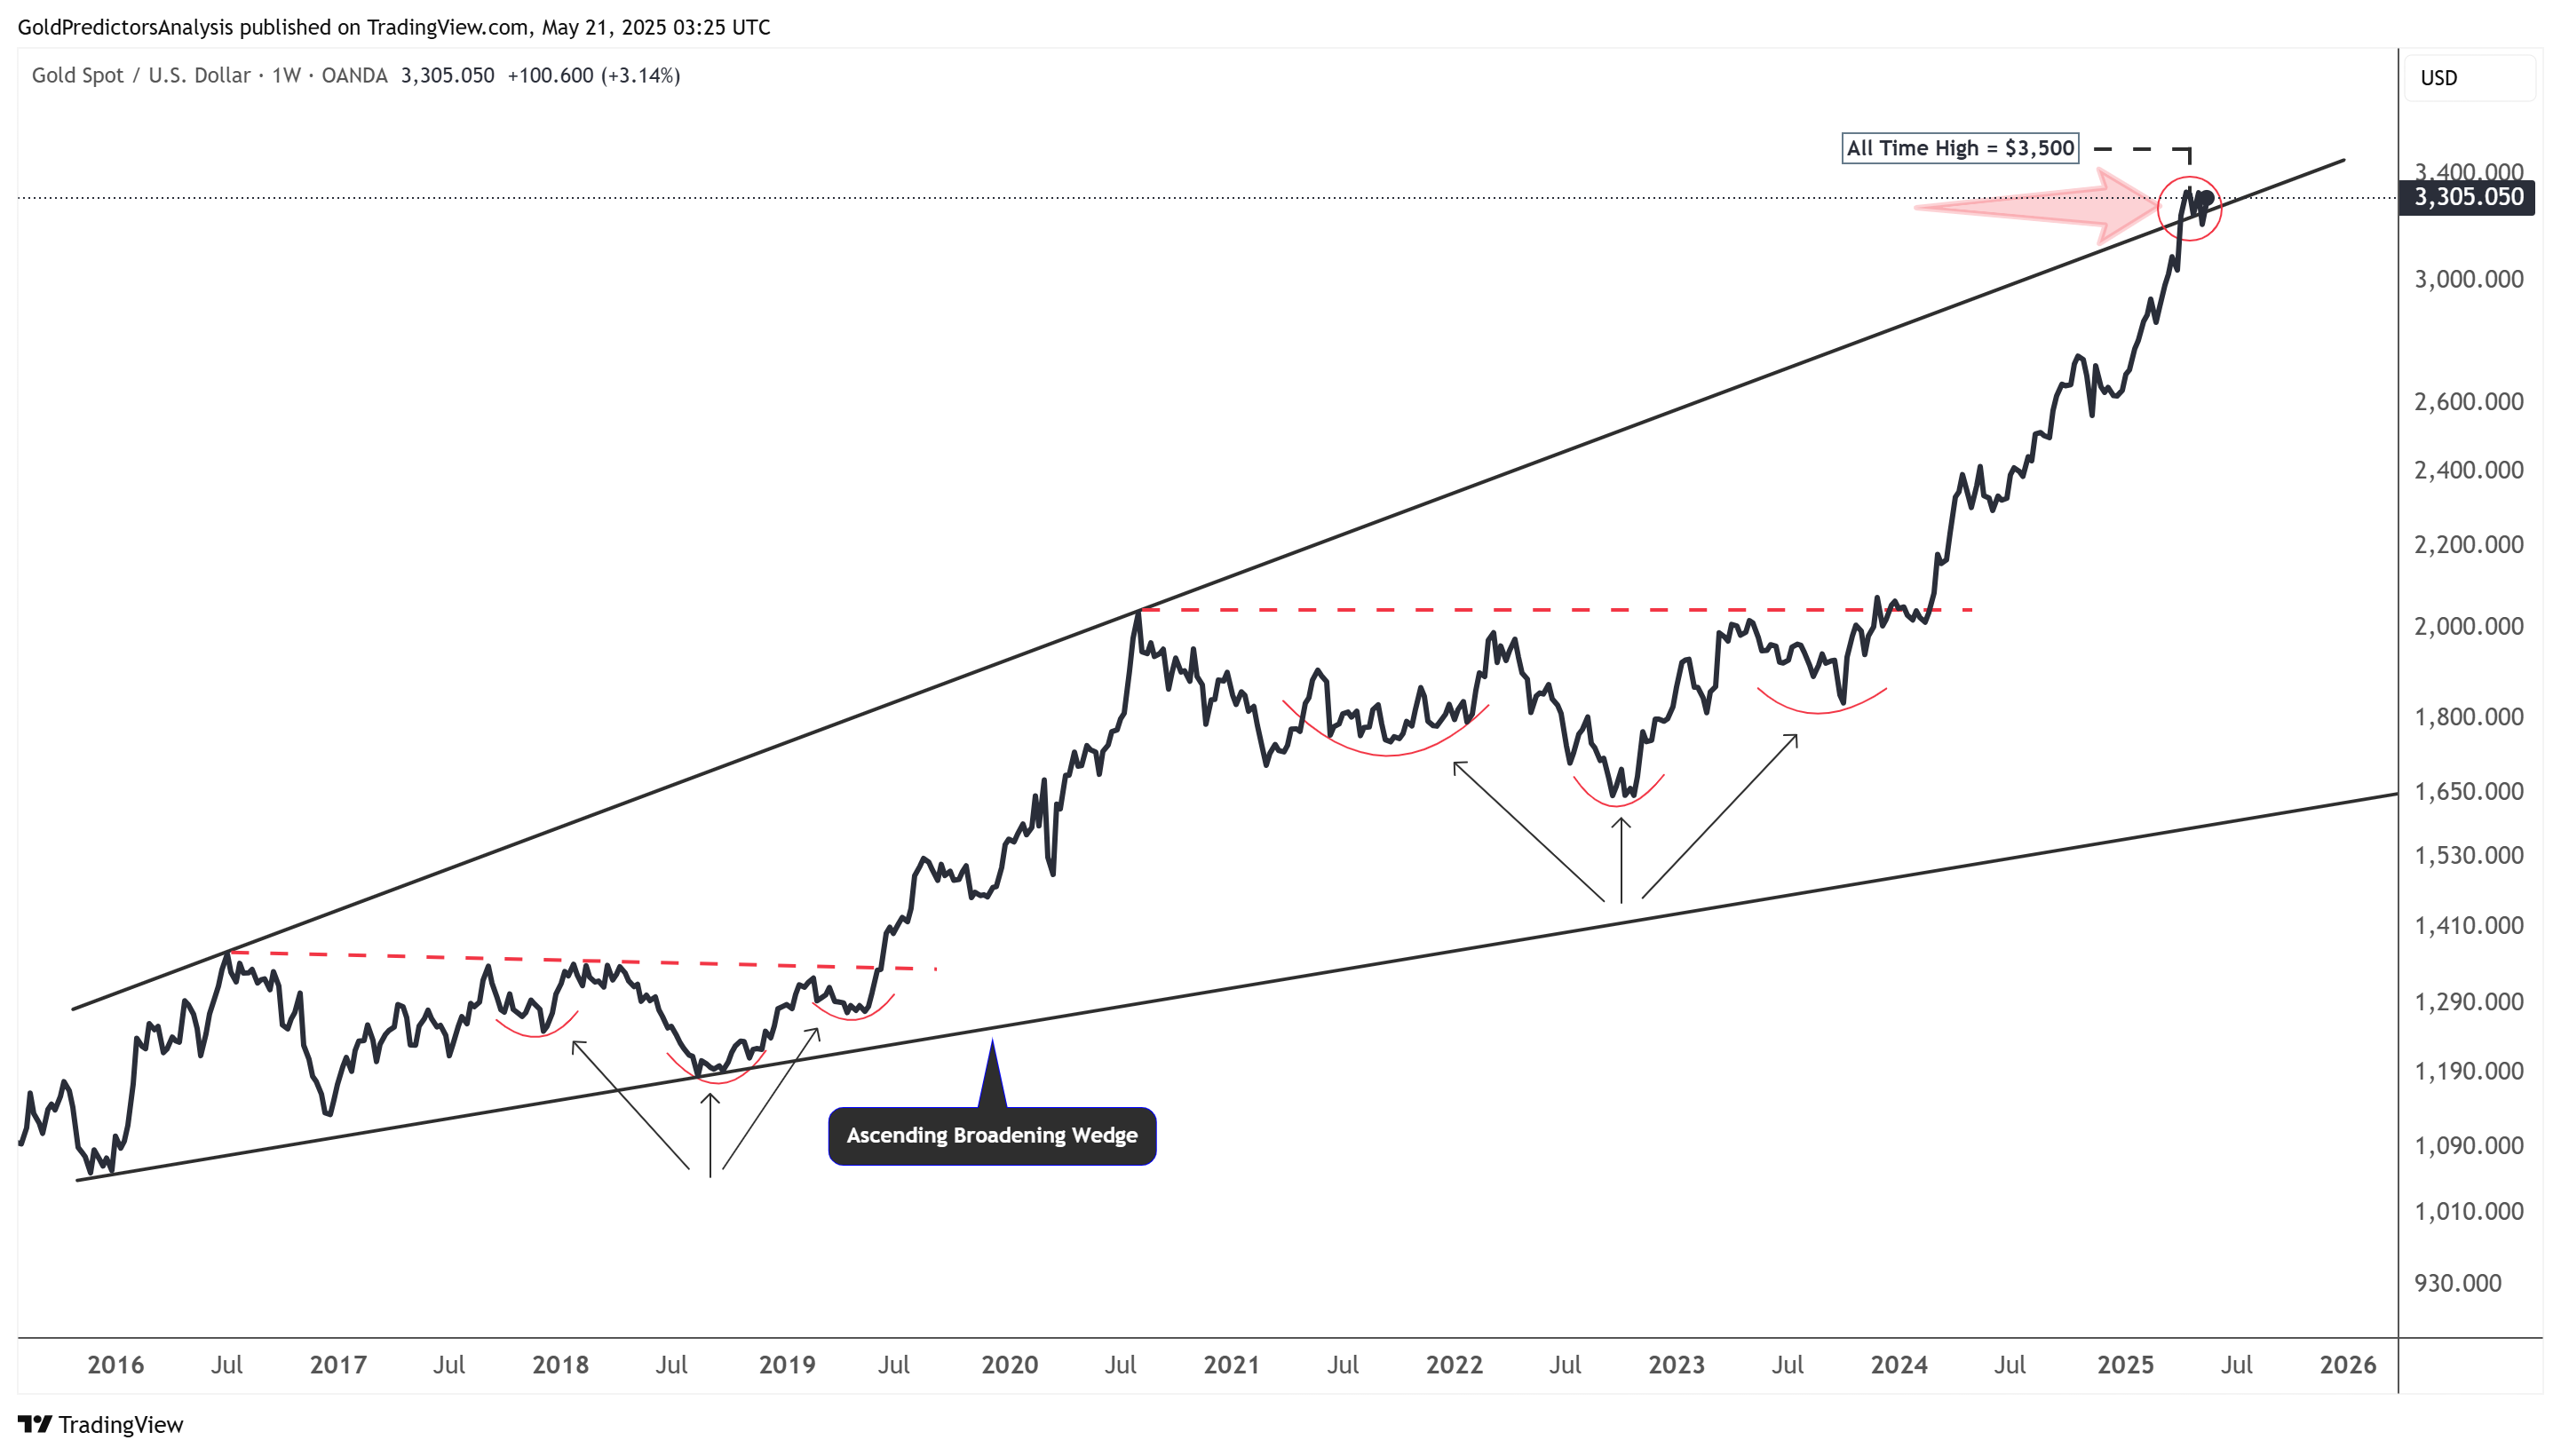
The importance of the current price region in gold is also reflected in the chart below, which shows the formation of an ascending broadening wedge pattern. At present, the price is trading near the upper boundary of this wedge, where resistance is building. Meanwhile, the ongoing consolidation between the $3,200 and $3,500 range will determine the next major move. Furthermore, the emergence of the inverted head and shoulders pattern suggests that a breakout above $3,500 would trigger a strong bullish move toward the $4,000 region.
About the Author
Bob MasonChief Crypto Boss
123456789 30 He has written extensively for a broader audience and his current focus is on developments relating to the financial markets including, but not limited to currencies, commodities, alternative asset classes, and global equities.


Advertisement