
Advertisement
Advertisement
Natural Gas Price Forecast: Gas Rebounds, Eyes Breakout Above $3.84 Resistance
By:
Natural gas staged a bullish reversal Monday, reclaiming key moving averages and setting the stage for a breakout above $3.84 in an emerging ABCD pattern.
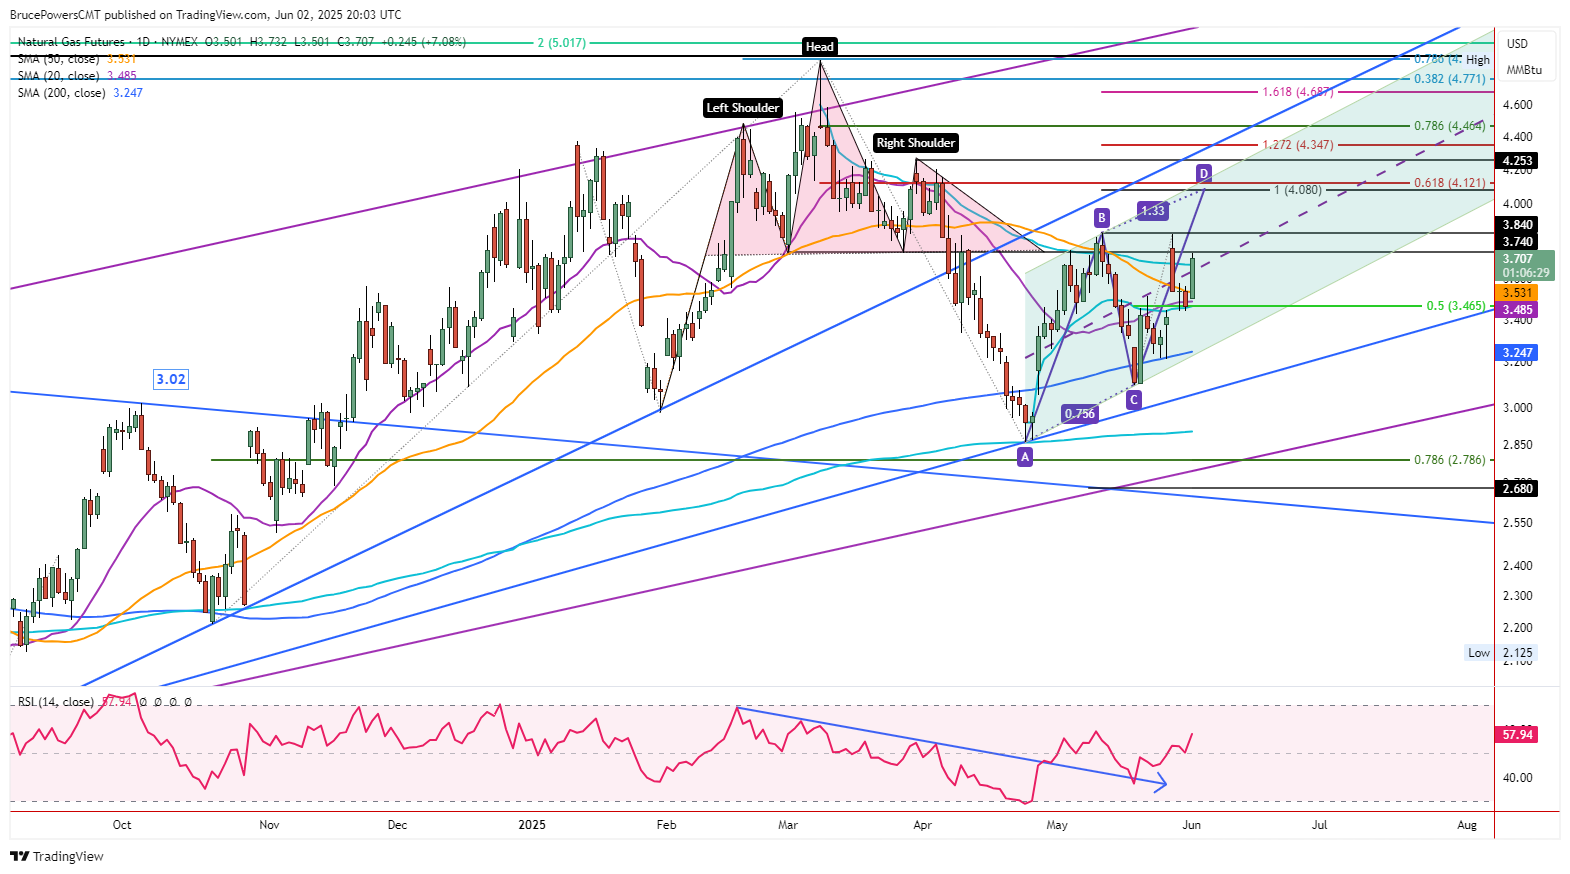
The bulls returned on Monday as natural gas rallied to a three-day high of $3.73 and triggered a bullish reversal. After establishing a low of $3.50 for the day and successfully testing support around the 20-Day MA, natural gas rallied to reclaim the 50-Day MA, which had acted as an area of resistance the prior two days. It looks likely to confirm the breakout with a daily close above Friday’s high of $3.56 today, along with the 50-Day MA, currently at $4.53. Currently, trading continues in the top third of the day’s trading range, showing that buyers remain in charge. Moreover, today will be the highest daily closing price for the advance that began from the recent higher swing low (C).
Hits Three Day High
Given today’s bullish reversal signal, last Thursday’s low of $3.44 established a higher swing low within a near-term uptrend structure that is contained within the developing CD leg of a potential rising ABCD pattern. The ABCD pattern is within a potential bullish trend channel that is highlighted in light green. Support for the bearish pullback was seen last around the confluence of a 50% retracement level, the 20-Day MA, and an AVWAP level from the May swing low (A).
Price Rejected from Strong Support
Given the subsequent bullish reaction from that support zone, natural gas looks poised to challenge and possibly exceed the $3.84 lower swing high (B). A decisive breakout above $3.84 would trigger the ABCD pattern as a higher swing high would be established and a daily close above that level would confirm the breakout.
The first higher target zone is $4.08 to $4.12, consisting of the initial target for the rising ABCD pattern and the 61.8% Fibonacci retracement, respectively. Potential resistance around the top line of the trend channel may also provide clues about supply and demand, particularly if it lines up with another indicator once approached by price.
Right Shoulder a Potential Barrier
If the price of natural gas continues to rise it will eventually encounter potential resistance around an interim swing high of $4.25. That swing high established the right should for a recent head and shoulders bearish reversal pattern. It marks a lower high in the bearish correction that started after the $4.90 peak in March. A violation of that bearish price structure would be bullish and provide another bullish reversal signal.
For a look at all of today’s economic events, check out our economic calendar.
About the Author
Bruce Powerscontributor
Bruce has been involved in the financial markets for over 20 years, as an analyst, trader, educator, and writer.


Advertisement