
Advertisement
Advertisement
Natural Gas and Oil Forecast: OPEC+ Output Talk Sparks Volatility Below $65
By:
Key Points:
- Brent and WTI both posted weekly losses—down 1.9% and 2.5% respectively—as OPEC+ considers a July supply hike.
- OPEC+ may raise output by 411,000 bpd in July, adding to the 1 million bpd boost already planned through June.
- WTI dropped below trendline and major EMAs, now targeting support at $60.06 and $59.15 if resistance holds.

Market Overview
Crude prices slid for a fourth straight session Friday, with Brent down 1.9% and WTI losing 2.5% for the week—marking the first weekly decline in three weeks. The selloff was driven by renewed supply concerns after reports suggested OPEC+ may raise output by 411,000 barrels per day in July.
This potential increase, if confirmed at the June 1 meeting, follows prior commitments to boost production by 1 million bpd across April to June.
While geopolitical tensions initially buoyed prices, they were overshadowed by U.S. inventory builds and rising storage demand, which has reached levels last seen during the pandemic. Traders now await rig count data as a gauge for near-term supply shifts.
Natural Gas Price Forecast
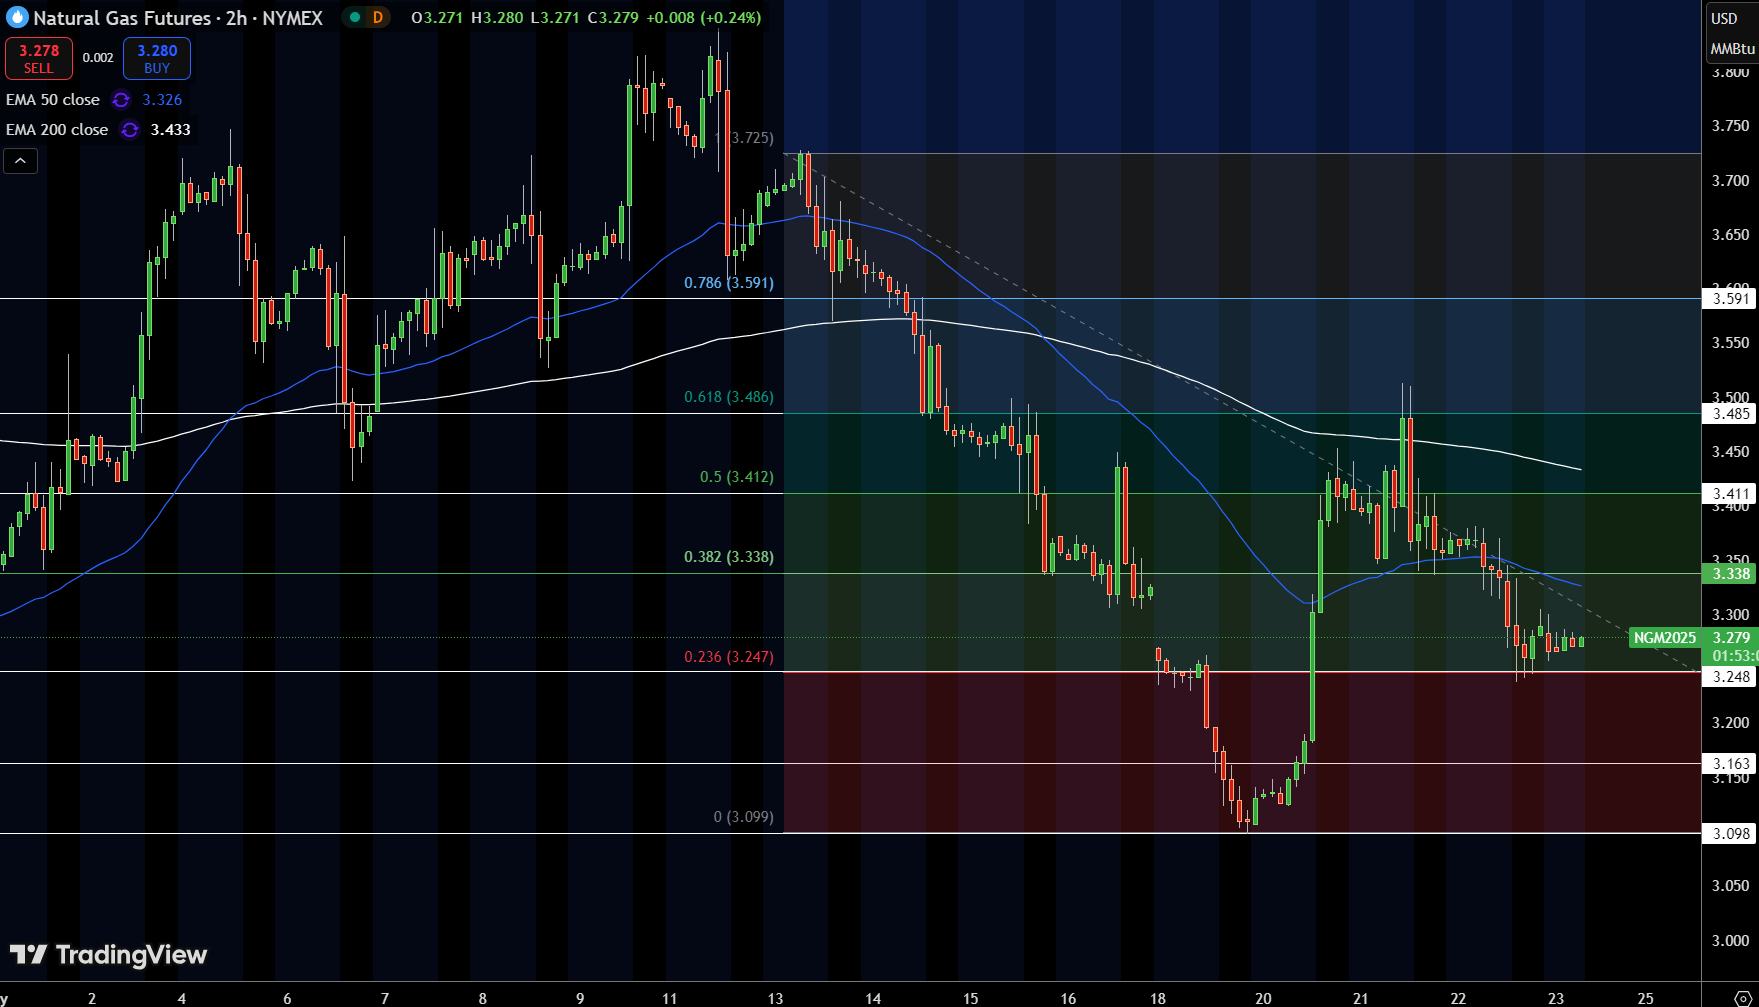
Natural gas is trading around $3.279, consolidating just above key Fibonacci support at $3.247 (23.6% retracement), after a steady downtrend from the recent $3.725 high. Price action remains capped by both the 50-EMA at $3.326 and the 200-EMA at $3.433, keeping near-term bias tilted to the downside.
A descending trendline is also holding, highlighting persistent bearish pressure. While MACD isn’t shown, recent candles are forming tight ranges, suggesting indecision and low momentum. A break below $3.247 could expose the next support at $3.163, with further downside toward $3.098.
On the upside, reclaiming $3.338 would be the first signal that buyers are returning, potentially opening a path toward $3.412 and $3.486.
WTI Oil Price Forecast
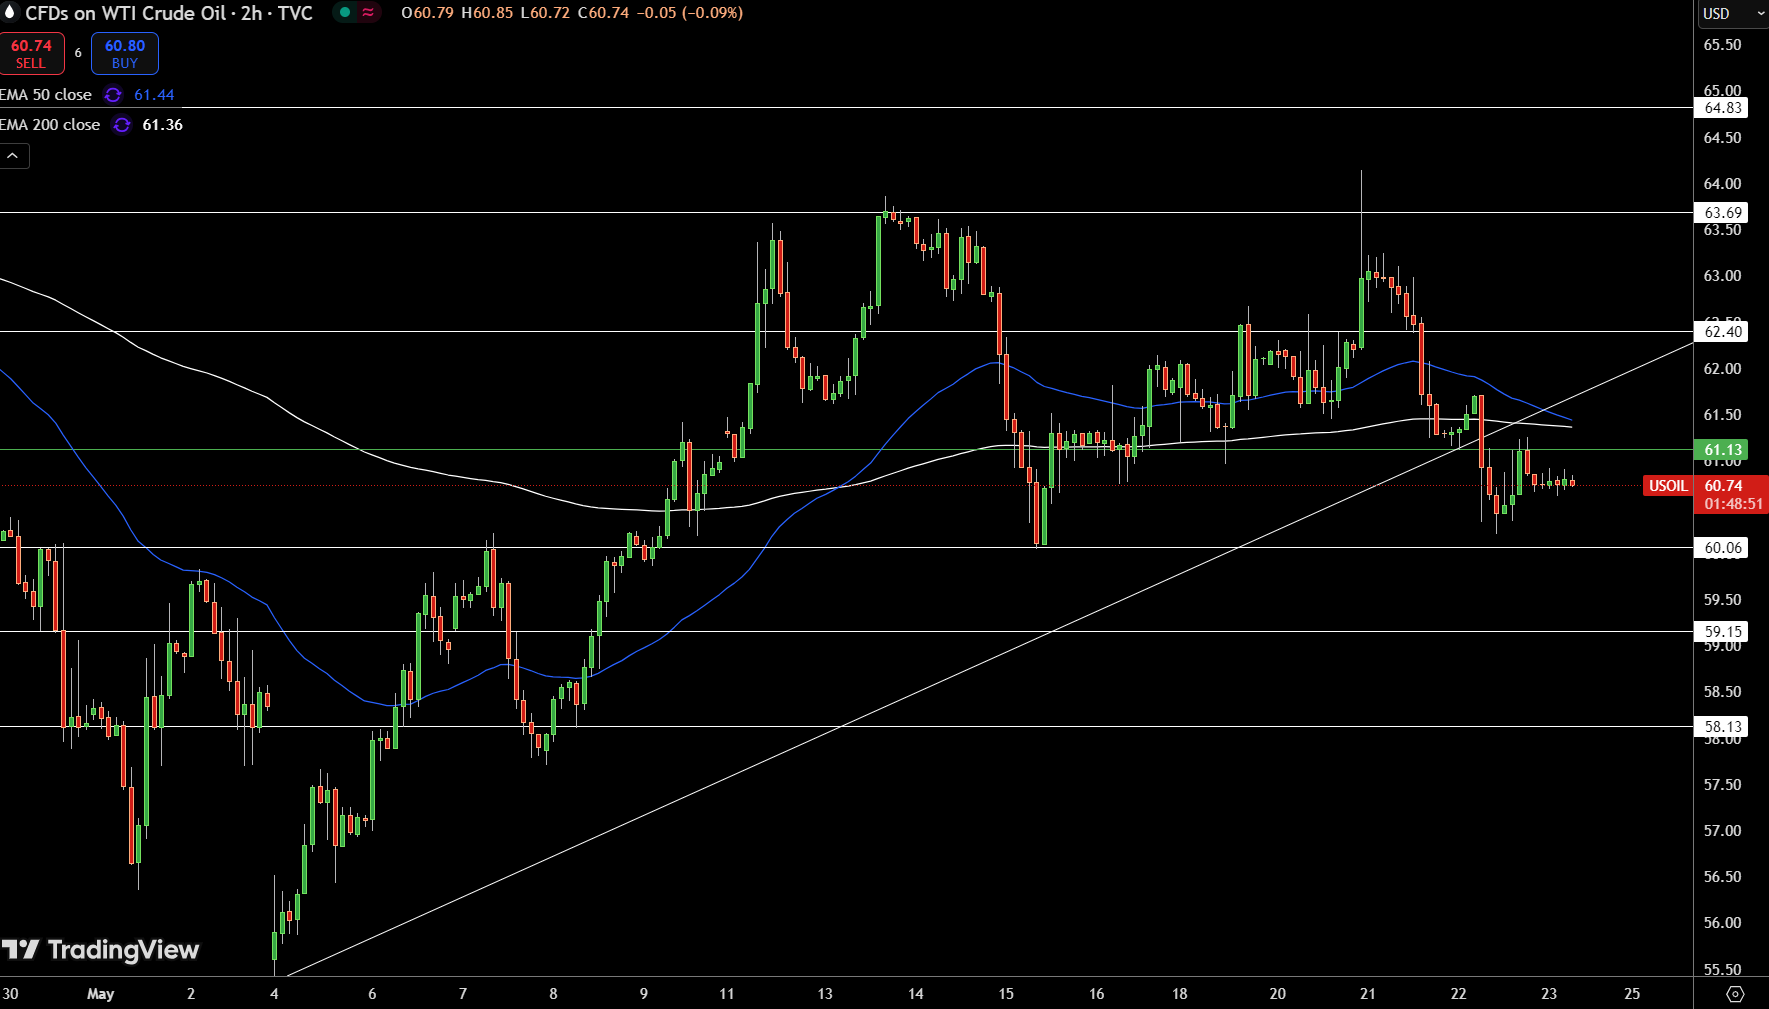
Crude oil is trading at $60.74 and has slipped below a key trendline that previously defined its early May recovery. This drop also pulled the price under both the 50-period EMA at $61.44 and the 200-period EMA at $61.36, signaling a possible shift in momentum.
The $61.13 mark, now a pivot level, is acting as immediate resistance after price failed to hold above it during the last session. If price continues to stall beneath these moving averages, sellers may gain confidence to push toward $60.06, with $59.15 as the next support.
A move back above $61.40 with volume could invalidate this bearish bias, but for now, oil appears to be settling into a lower range while market participants reassess direction.
Brent Oil Price Forecast
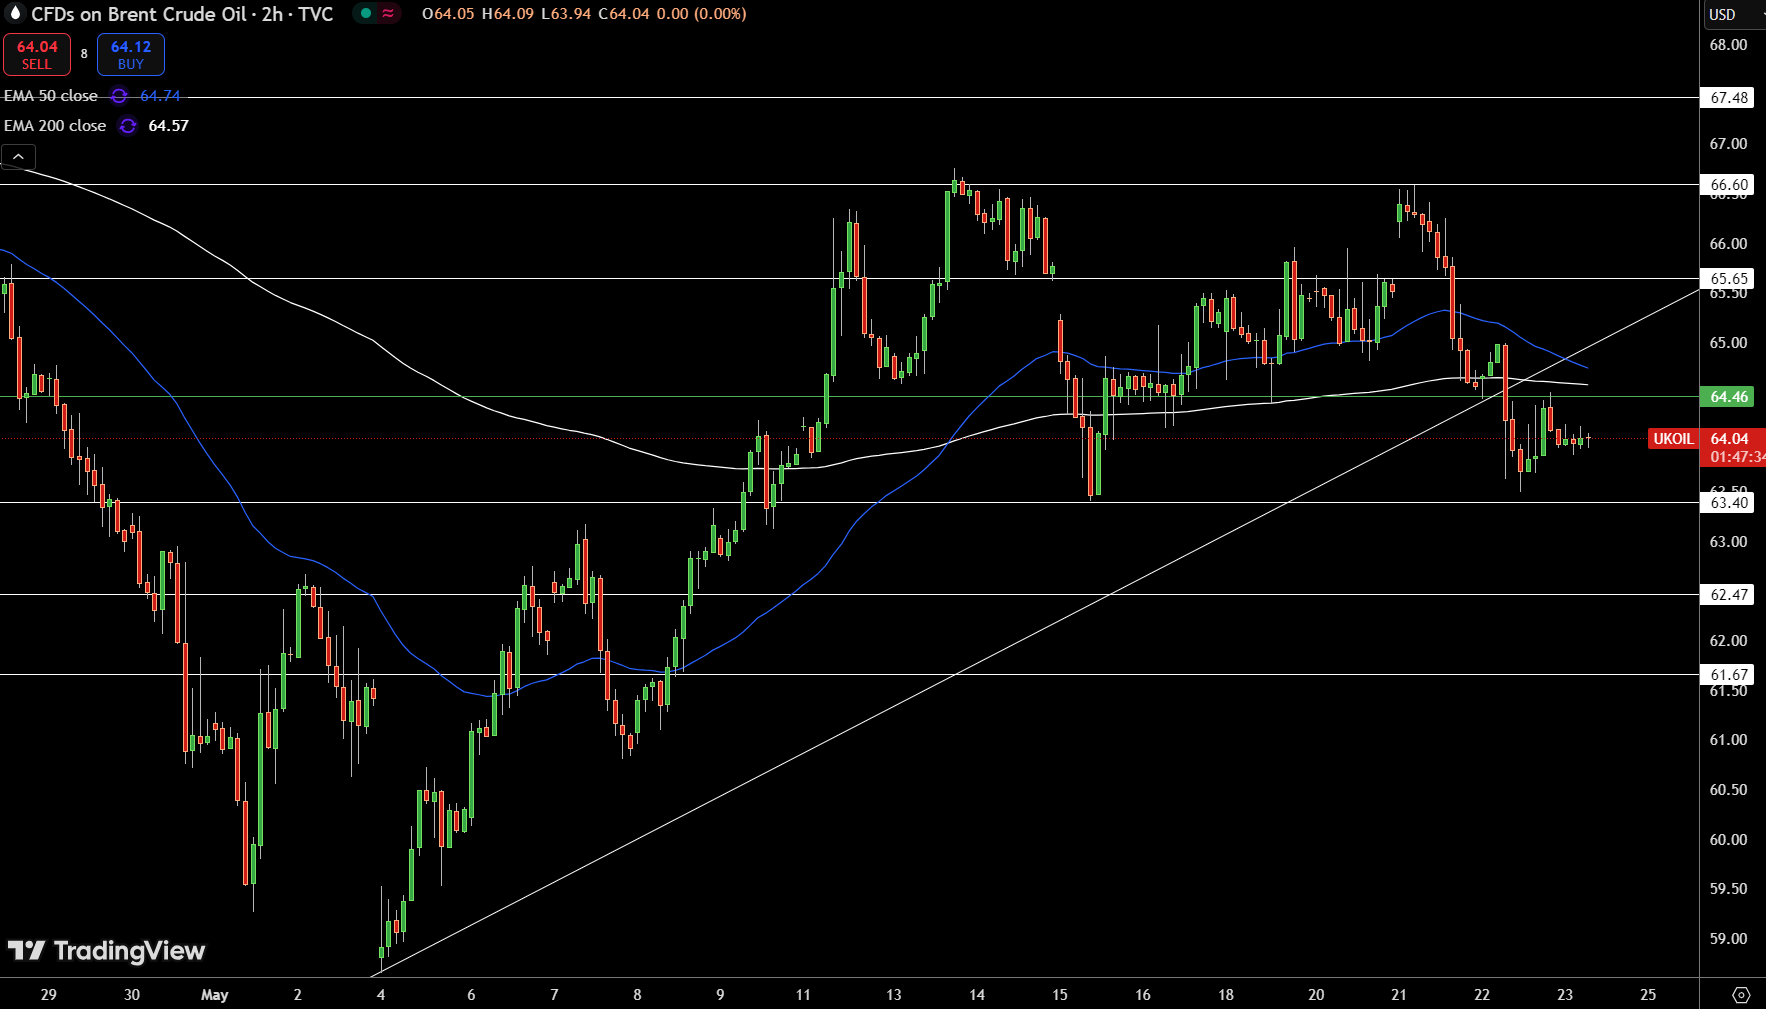
Brent crude is trading at $64.04 after slipping below its 50-EMA ($64.74) and 200-EMA ($64.57), both of which have flattened, suggesting a lack of clear directional momentum. The break beneath the rising trendline adds to the case for a short-term bearish shift, especially as the price continues to reject the $64.46 pivot level.
Small-bodied candles forming just below this area reflect hesitation, with sellers gradually gaining ground. Immediate support lies at $63.40, with further downside potential toward $62.47 if current levels give way. For bulls, reclaiming $64.46 with a strong close above the moving averages would be needed to regain control.
About the Author
Bob MasonChief Crypto Boss
123456789 30 He has written extensively for a broader audience and his current focus is on developments relating to the financial markets including, but not limited to currencies, commodities, alternative asset classes, and global equities.


Advertisement