
Advertisement
Advertisement
Natural Gas and Oil Forecast: OPEC+ Output Hike, Technical Resistance Define Oil Price Path
By:
Key Points:
- OPEC+ will boost oil output by 411K bpd in July, shifting from the earlier planned 134K bpd increase to meet market demand.
- Brent Oil holds near $64.29 with higher lows forming; breakout above $65.03 could signal a bullish move toward $66.59.
- Natural Gas futures hover at $3.547, trapped in a contracting triangle; breakout targets $3.836 while support lies at $3.347.

Market Overview
OPEC+ has announced plans to boost oil output by 411,000 barrels per day (bpd) in July, a significant shift from the previously considered 134,000 bpd increase. This decision, made during a virtual meeting of major producers including Saudi Arabia, Russia, and others, reflects a cautiously optimistic view of global market fundamentals amid low inventories.
However, the group emphasized flexibility, indicating that these increases could be paused if necessary. Geopolitical tensions continue to weigh on energy markets, heightening uncertainty and potentially amplifying volatility in both natural gas and oil forecasts.
Natural Gas Price Forecast
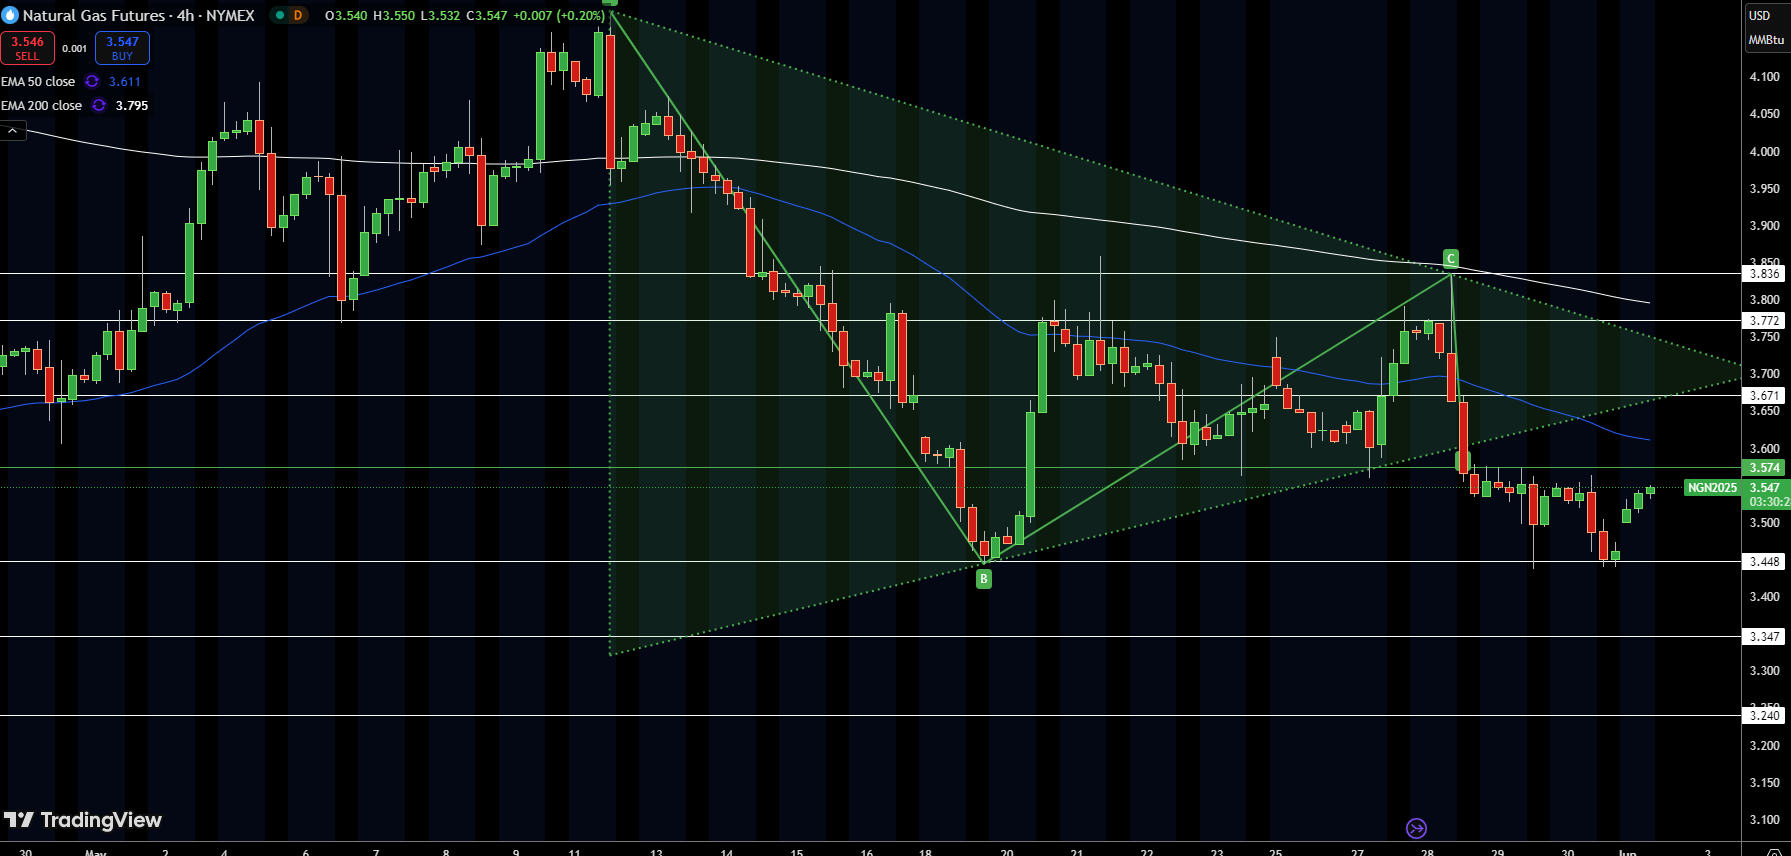
Natural gas futures are hovering near $3.547 after a volatile few sessions. On the 4-hour chart, price action is caught between two converging trendlines, forming a contracting triangle. The upper boundary, ranging from $3.611 to $3.795, offers immediate resistance, while support is located near $3.448 and $3.347.
Recent candles show hesitation near resistance, but a breakout above the trendline could target $3.772 or $3.836. Conversely, a close below $3.448 might pull prices toward $3.347 or even $3.250.
With price consolidating between the 50-period EMA at $3.611 and 200-period EMA at $3.795, traders should watch for a decisive breakout to confirm the next move.
WTI Oil Price Forecast
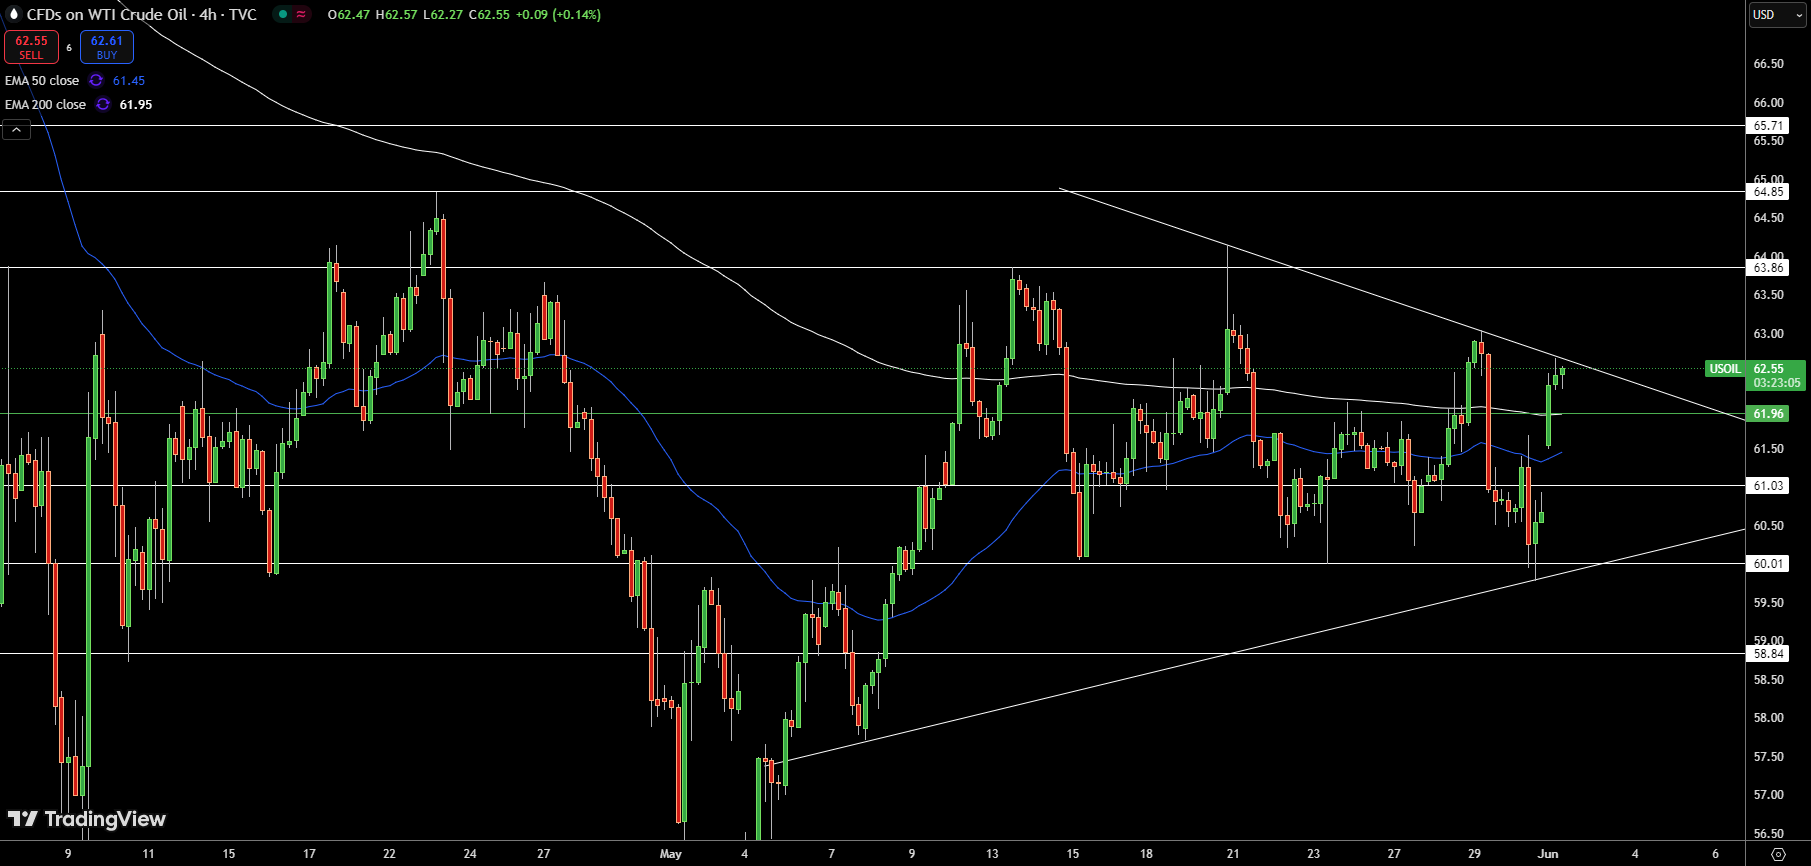
WTI Crude Oil is hovering at $62.55, grappling with the descending trendline and key resistance at $63.02. Price action highlights repeated attempts to break higher, but each push has met with sellers stepping in. The 50-period EMA at $61.45 is acting as a dynamic support zone, while the 200-period EMA looms overhead as a tough barrier.
A clear breakout above $63.02, confirmed by a strong bullish candle and increased trading volume, could propel WTI toward $63.87 or even $64.85. Conversely, if support at $61.03 fails, the next targets lie at $60.01 or $58.84.
For now, WTI remains in a tight range, with price action showing a slight bullish bias, though a decisive breakout is still needed to shift momentum.
Brent Oil Price Forecast
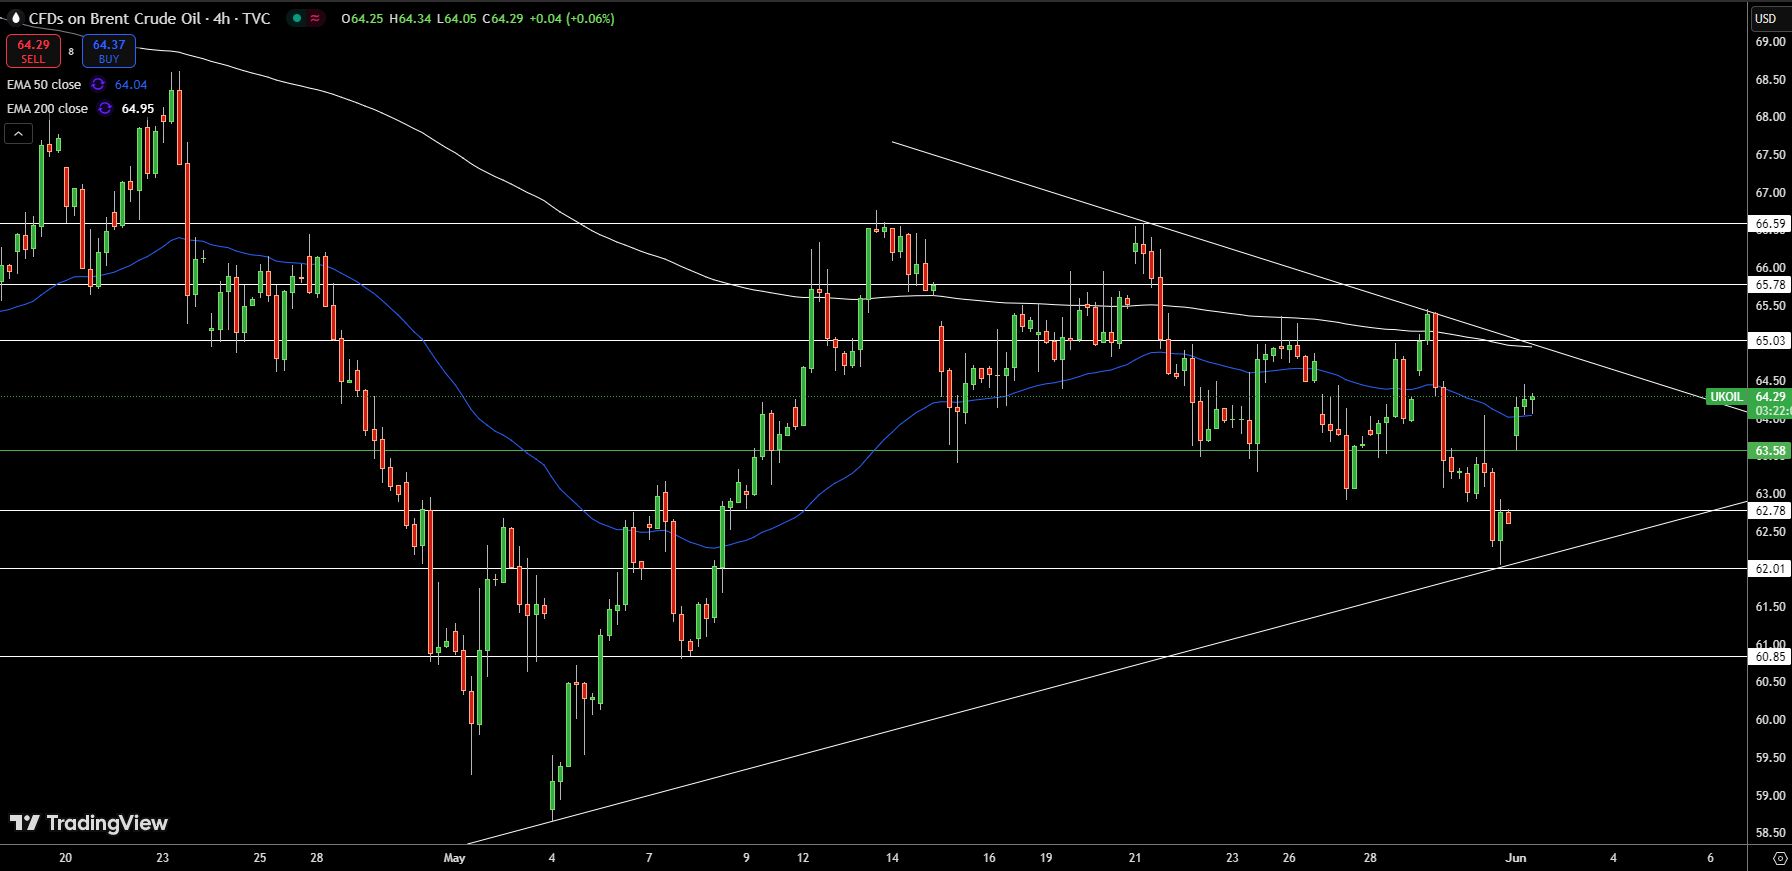
Brent Crude Oil (UKOIL) is trading at $64.29, showing resilience near the descending trendline and just below the 50-period EMA ($64.04). Price action remains squeezed between the $63.58 support level and $65.03 resistance.
The recent sequence of higher lows off $63.58 suggests buyers are stepping in, while the failure to break above $65.03 hints at caution. A confirmed close above this level would open the door to $65.78 or even $66.59, with a solid bullish candlestick formation serving as a trigger.
On the downside, a sustained break below $63.58 could signal further losses toward $62.78 or $62.01. Until a breakout emerges, Brent’s bias remains range-bound with a cautious bullish undertone.
About the Author
Bob MasonChief Crypto Boss
123456789 30 He has written extensively for a broader audience and his current focus is on developments relating to the financial markets including, but not limited to currencies, commodities, alternative asset classes, and global equities.


Advertisement