
Advertisement
Advertisement
Crude Oil Price Forecast: Retreats Sharply After $78 High Reversal
By:
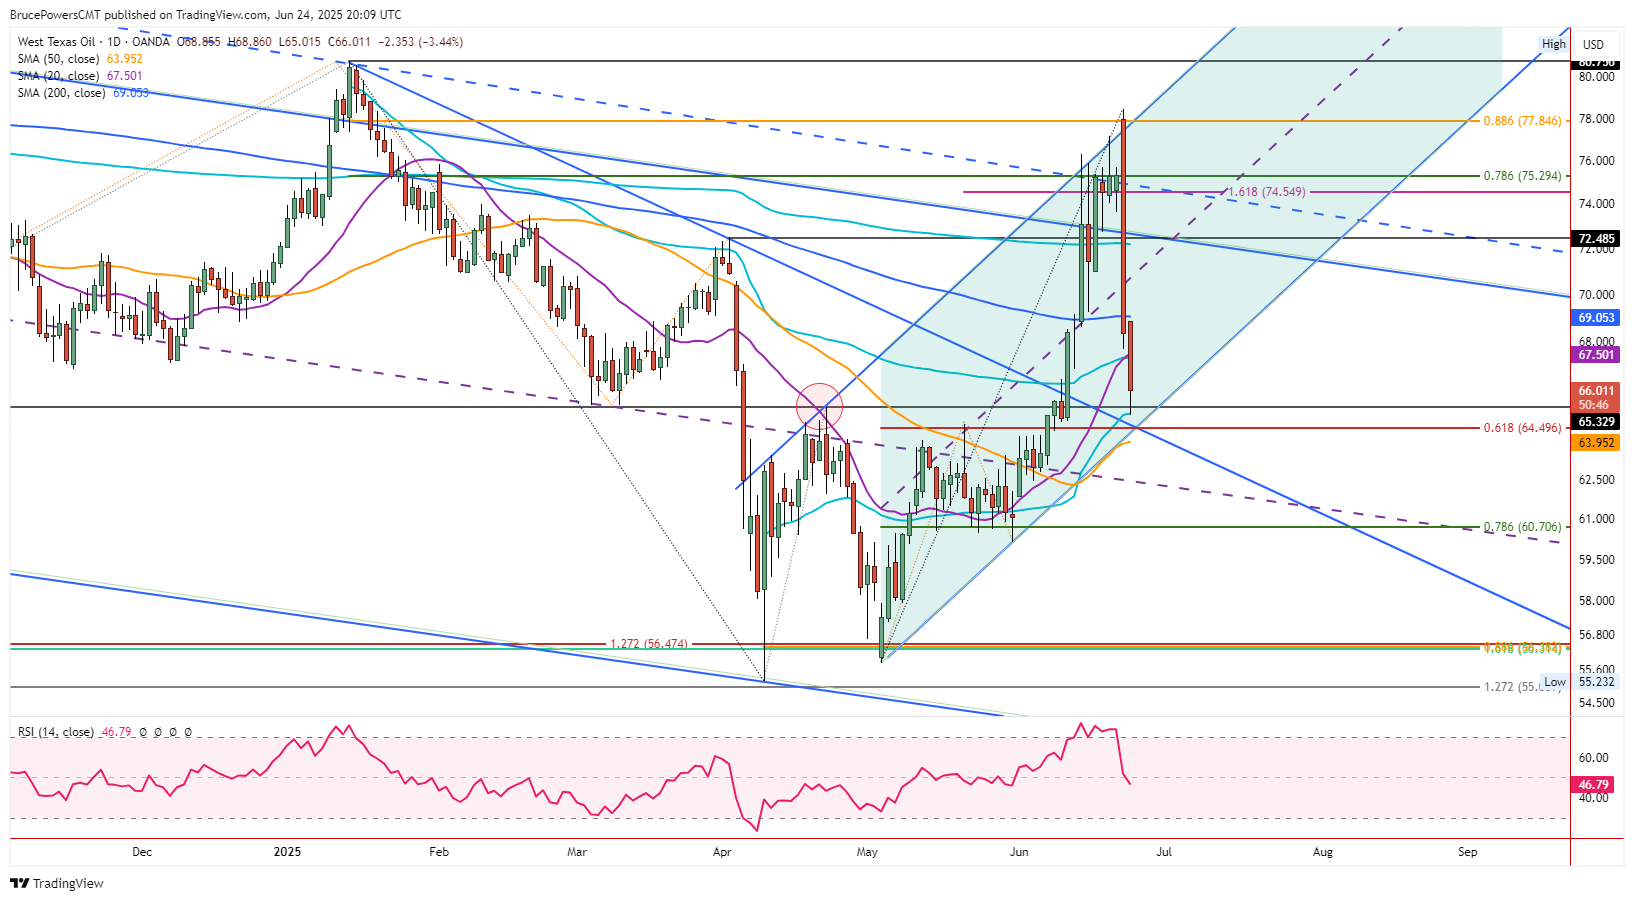
Crude oil reversed sharply after reaching $78.44 to start the week, breaking key support levels, before testing the neckline of a double bottom near $65 on Tuesday.
Despite a sharp rise in volatility over the past two days, crude oil seems to have recognized certain price levels. On Tuesday, it continued a bearish correction that followed a new trend high of $78.44 on Monday. Monday’s day’s price range and candle body engulfed the price range of the prior six days, reflecting significant bearish sentiment. And the close was bearish, in the lower quarter of the day’s price range and below the 200-Day MA. On Tuesday, crude oil established a lower daily low and lower high and confirmed resistance around the 200-Day MA. Subsequently, the 20-Day MA support area, now at $67.48, broke earlier in the session.
Sellers Remain in Control
Trading continues near the lows of the day at the time of this writing, which was at $65.02, and crude oil looks poised to end Tuesday’s session in a similar bearish position. Nonetheless, Monday’s rally completed an 88.6% Fibonacci retracement at $77.85 and another test of resistance at the top of a rising trend channel. Capitulation followed those behaviors. Given the symmetry present in a rising channel (50% dashed line), there is likely to be an eventual touch of the lower rising trendline before too long. It was almost completed today but support was found instead a little above the trendline.
Reaches Potential Strong Support Zone
In fact, today’s pullback was a successful test of support at the neckline of a double bottom, which was $65.32. The sharp upswing from two weeks ago got going after that breakout. Moreover, the potential significance of today’s low at $65.02 has increased since it is also marked by an AVWAP line starting from the April swing low. Clearly, the market seems to have recognized that price level. Whether it continues to do so remains to be seen.
Dip to $64.50 Still Possible
Since support and resistance levels point to areas of price, a further dip down to the 61.8% Fibonacci retracement level at $64.50 could yet be seen. Notice that a similar price level is indicated by the crossover of an uptrend and downtrend line, as well as a prior interim swing. After that is the dynamic 50-Day MA trend indicator, now at $63.95. It was last reclaimed and confirmed at the beginning of June. The current decline is the first approach to test it as support since then. And of course, it would be a stronger indication of demand if support and a bullish reversal were seen well above the 50-Day line.
For a look at all of today’s economic events, check out our economic calendar.
About the Author
Bruce Powerscontributor
Bruce has been involved in the financial markets for over 20 years, as an analyst, trader, educator, and writer.


Advertisement