
Advertisement
Advertisement
Crude Oil Price Forecast: Rally Stalls Near Trendline, Shooting Star Emerges
By:
Crude oil’s advance has nearly mirrored April’s drop, while trendline resistance and a bearish candle raise the risk of a near-term pullback.
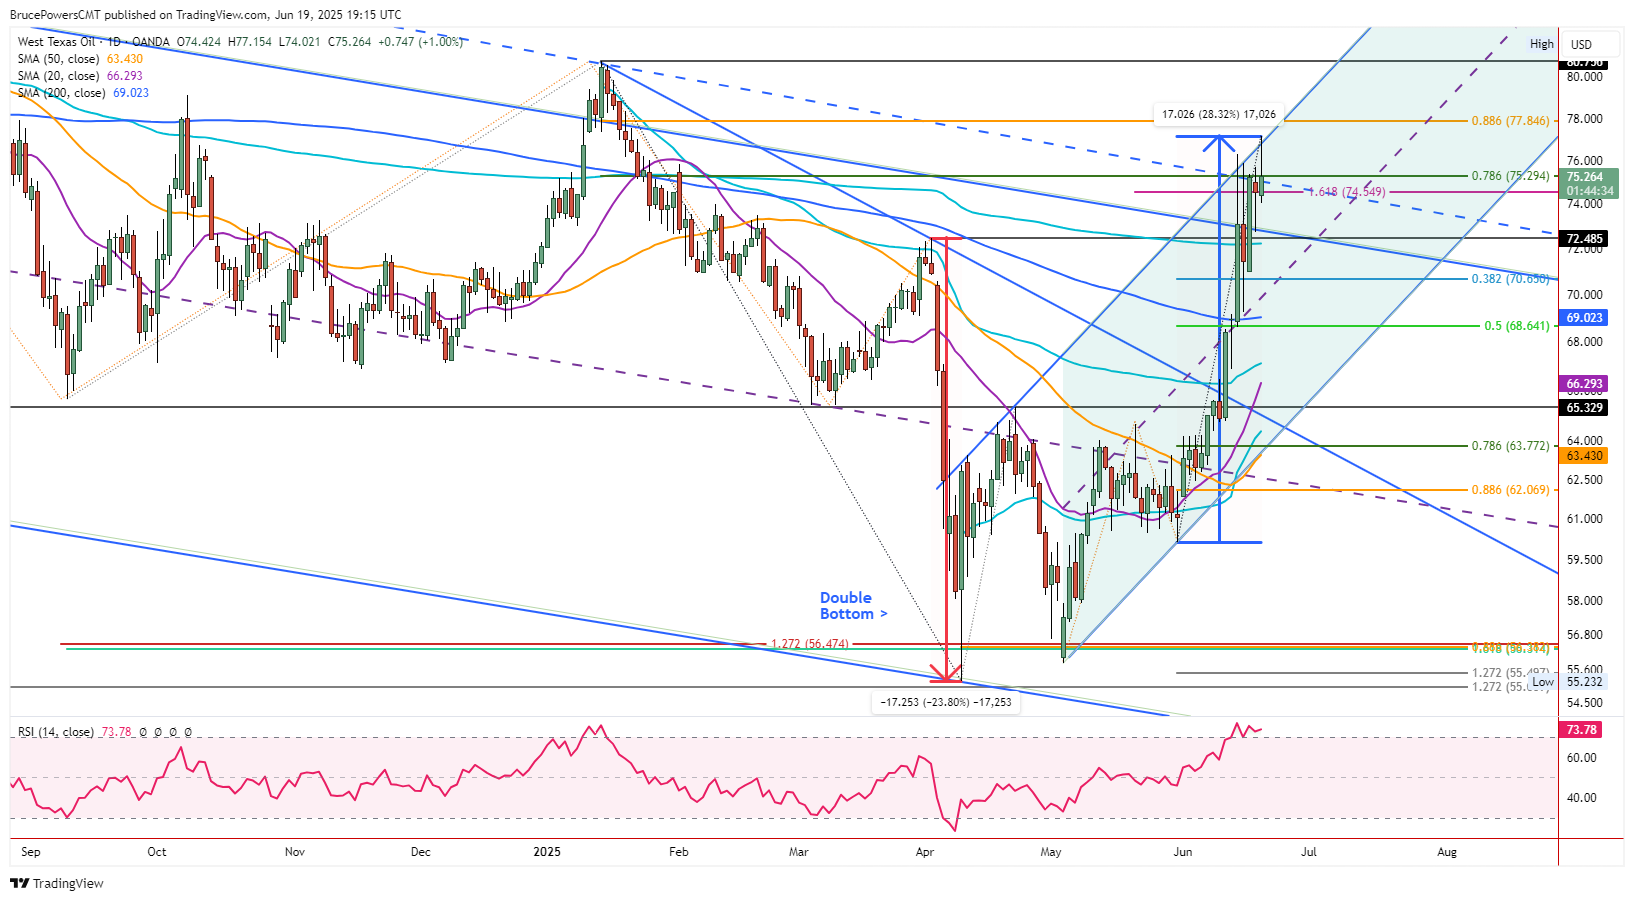
Crude oil extended gains on Thursday, reaching a new trend high of $77.15. That high was a little shy of an 88.6% Fibonacci retracement at $77.85. It has been in an area of resistance around a top trendline for five days now. Although a new trend high is a sign of strength, the advance may have gotten ahead of itself and is due to pullback. Notice that there has not yet been a daily close above the trendline until today, and it is the highest daily closing price for crude oil since late-January. However, the day ended with a potentially bearish shooting star candlestick pattern.
Reaction to Sharp Decline
One way to think about the current rally is in relationship to the sharp decline that followed the April lower swing high due to similar volatility. The total decline, from high to low, was $17.25, while the current advance when measured from the higher swing low (C) from May 1, was $17.03. Once there is similarity to a prior swing there is the potential for resistance, in this case. Moreover, notice how resistance was seen recently at a top rising parallel trend line. The line parallels the uptrend line that starts from the higher swing low in May and shows symmetry within a rising trend channel.
Resistance Persists
Today’s high provided a third daily test of the line and resistance was seen once again. Once symmetry in the rising channel is confirmed, there is the potential for a pullback or bearish reversal. A decline below Thursday’s low of $74.02 will trigger the bearish shooting star candle and a one-day bearish reversal off identified resistance.
Key support is the 200-Day MA, now at $69.02, while a minimum decline is anticipated to the 38.2% Fibonacci retracement at $70.65. Watch the 200-Day line along with a 50% retracement level at $68.64. Another area to watch for early support is around an AVWAP level at $72.24. It is potentially significant since it is anchored long-term, starting at the April 2024 swing high day.
For a look at all of today’s economic events, check out our economic calendar.
About the Author
Bruce Powerscontributor
Bruce has been involved in the financial markets for over 20 years, as an analyst, trader, educator, and writer.


Advertisement