
Advertisement
Advertisement
Bitcoin Price Will Rise 50-80% By October: Analyst
By:
Key Points:
- Analyst Cas Abbè predicts a 50–80% Bitcoin price rally by October 2025, citing similarities to the 2020 breakout.
- A bullish MACD crossover and fractal pattern strengthen the case for a parabolic move toward $150K–$180K.
- An inverse head-and-shoulders breakout on the weekly chart supports the forecast, with technical targets aligning near $180K.

Bitcoin (BTC) looks poised to grow by 50-80% by October, according to market analyst Cas Abbè.
A 2020 Fractal Key Catalysts Behind Bullish Bitcoin Outlook
The prediction stems from a recurring market structure that mirrors Bitcoin’s 2020 cycle. Back then, BTC consolidated inside a range before breaking out in October and rallying from $13,000 to over $40,000 within three months, a near 3x gain.
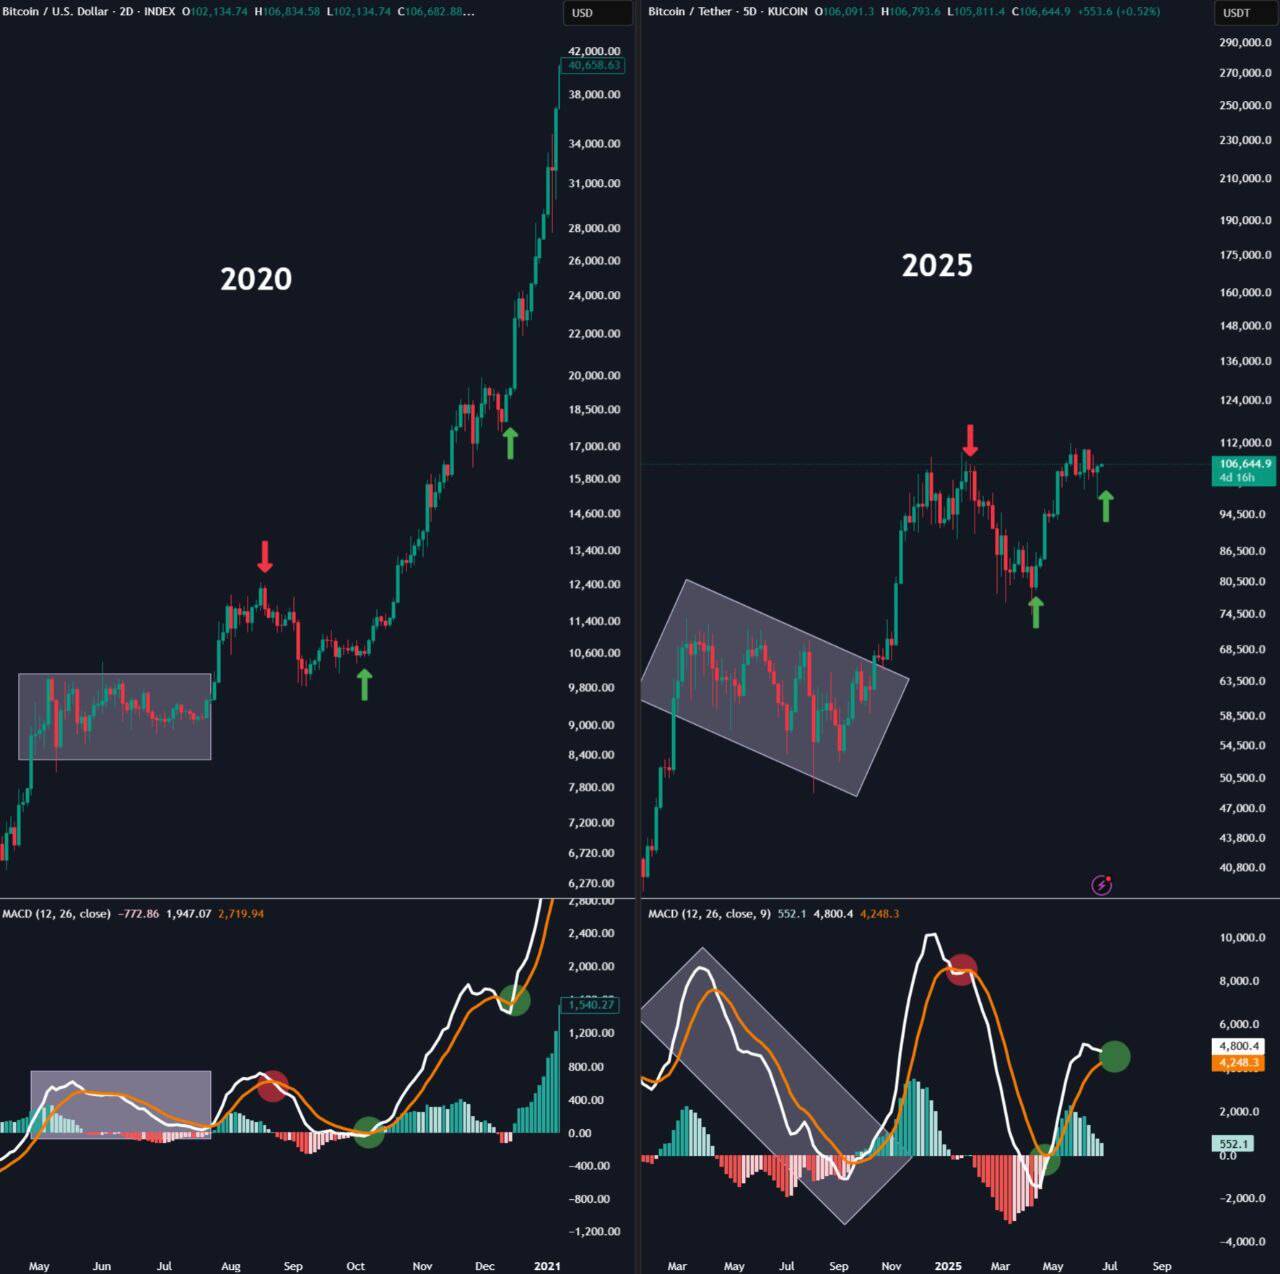
Abbè argues that the 2025 structure is “strikingly similar,” noting the breakout from a downward-sloping consolidation range, followed by a minor correction and a MACD crossover that triggered Bitcoin’s last parabolic run.
The accompanying chart draws a side-by-side comparison between Bitcoin’s 2020 and 2025 cycles, highlighting nearly identical setups. Both cycles show a range breakout, a brief correction marked by a red arrow, and a bullish MACD crossover soon after, represented by a green circle.
If history repeats, the analyst expects BTC to rally toward $150,000–$180,000 before forming a blow-off top later in the cycle.
Bitcoin’s MACD (Moving Average Convergence Divergence), a momentum indicator, has flipped bullish again, much like in late October 2020. This signal, often used to identify trend reversals, adds technical credence to Abbè’s thesis.
The analyst also dispelled notions of a “supercycle”—a theory that Bitcoin would avoid steep drawdowns due to increased institutional involvement. “Make no mistake, we are still in a 4-year cycle,” Abbè wrote, adding that it still “isn’t the supercycle.”
Inverse Head and Shoulders Signals Higher Bitcoin Targets
A weekly chart of BTC/USD also reveals a classic inverse head-and-shoulders pattern, a bullish reversal formation that often precedes significant price increases.
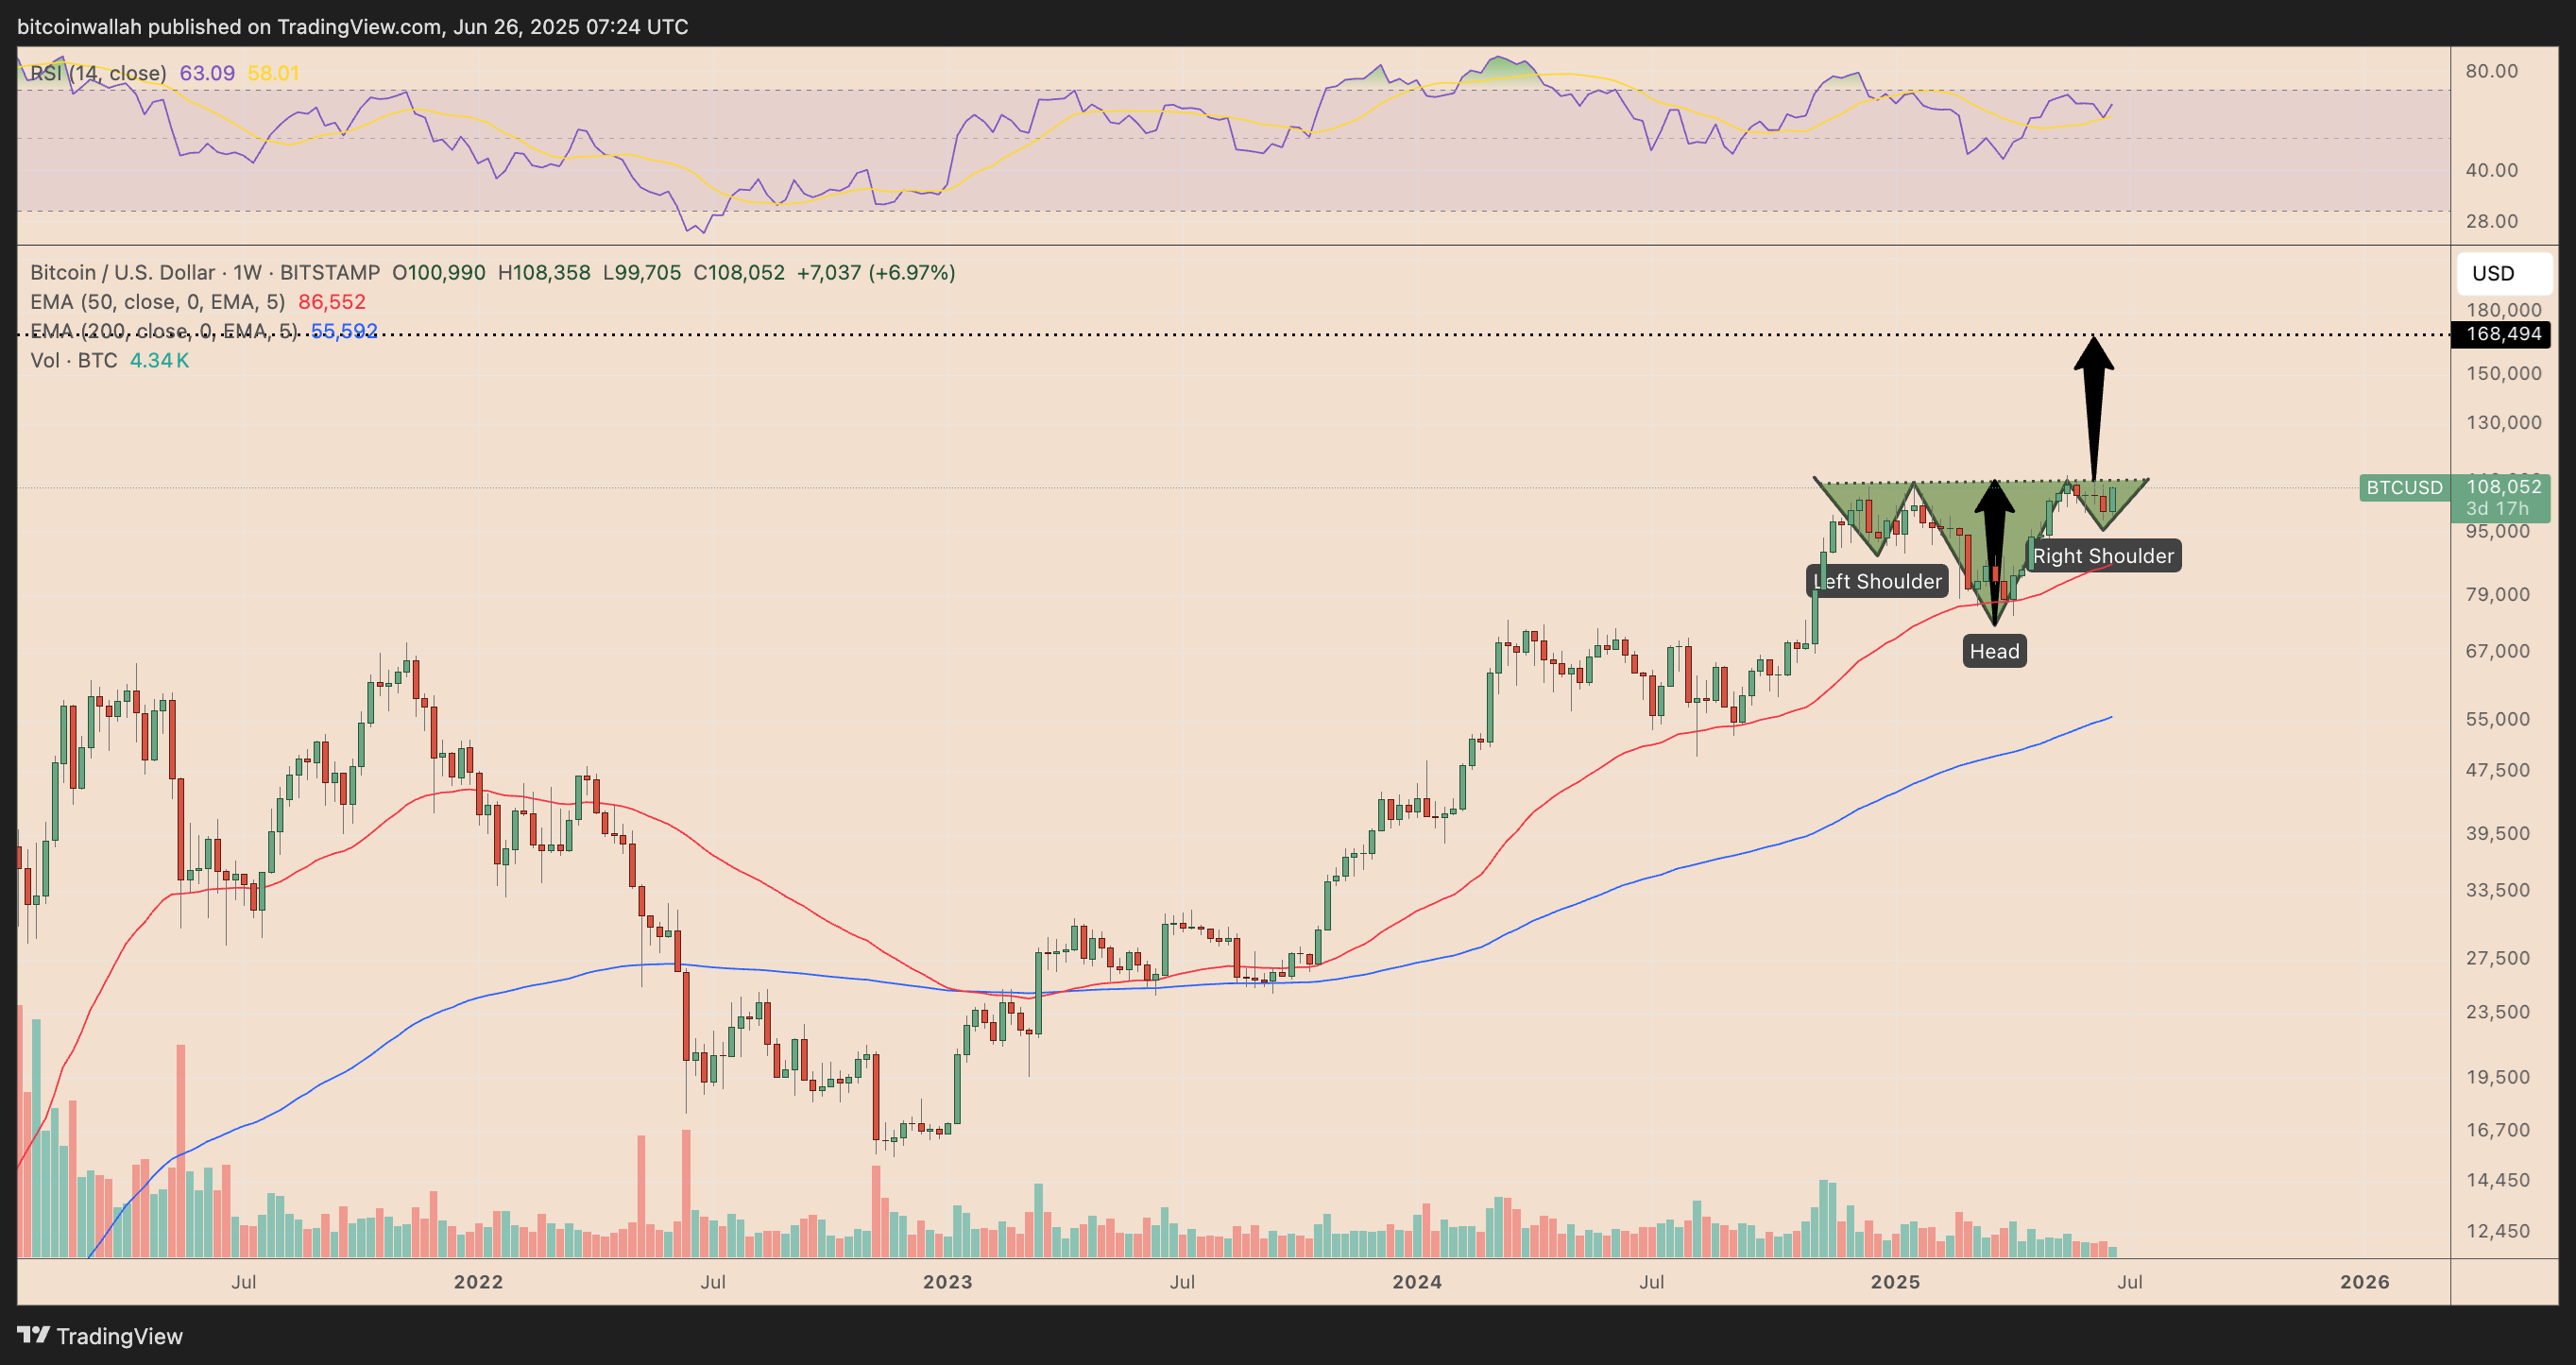
In this case, Bitcoin broke above the neckline at around $108,000. If the pattern plays out fully, it suggests a technical price target near $168,000–$180,000—aligning with Abbè’s broader forecast.
The breakout is supported by rising RSI and weekly close strength above both the 20- and 50-week exponential moving averages (EMAs), reinforcing bullish momentum into Q3 2025.
About the Author
Bob MasonChief Crypto Boss
123456789 30 He has written extensively for a broader audience and his current focus is on developments relating to the financial markets including, but not limited to currencies, commodities, alternative asset classes, and global equities.


Advertisement